It feels like almost everyone is just waiting for the world to fall apart…
Eight of the 11 top-level sectors are now in correction territory or worse. That means they’re roughly 10% (or more) below their most recent highs.
We also know that the Power Gauge transitioned to “neutral+” territory on the benchmark S&P 500 Index in mid-September. And more than a month later, it still holds that rating.
So it’s clear that investors face a tough market today.
And it gets worse…
The S&P 500 is near a dangerous line once again.
In short, the index is hovering near its 200-day moving average (“DMA”). That means the index’s current level is around its average closing price for the past 200 trading days.
When an asset or stock heads meaningfully below its 200-DMA, it symbolizes a downtrend. It’s an especially ominous sign for an entire index.
But as you’ll see today, other factors are at play in the market right now…
After spending decades studying the markets, I’ve learned the power of the trend.
Right now, the S&P 500’s trend is in question. We can feel the negative investor sentiment in almost every article we read. And perhaps more importantly, we can see it on the chart…
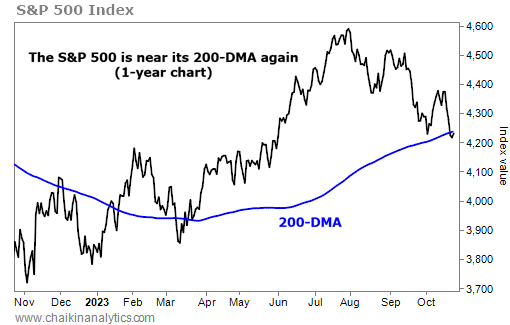
The solid black line follows the daily closing price of the S&P 500 over the past year. In other words, it’s a normal price chart.
The blue line adds another layer…
It’s the 200-DMA. As I said, that’s the average closing price of the past 200 trading days.
This indicator is described as the “moving” average because it updates every day to include the most recent 200 trading days. In turn, the 201st day rolls off the average.
The 200-DMA allows us to visualize and calculate the long-term trend. It’s especially useful in broad-market indexes like the S&P 500…
When the 200-DMA is pointing up and the index is trading above it, we’re in an uptrend. When it’s pointing down and the index is trading below it, we’re in a downtrend.
The problem is clear today…
The S&P 500 is once again right around its 200-DMA. So we’re in danger of starting a new downtrend in stocks.
But I want you to notice one other thing about the above chart…
As you can see, the 200-DMA line hasn’t turned lower yet. That’s important. It means the downtrend isn’t here yet.
I get it, though…
The current setup with the 200-DMA creates a huge amount of anxiety for a lot of investors. We’re seeing that play out right now. Many folks are scared to put their money to work.
In the end, my message remains the same…
Don’t let fear rule the day.
Be patient. But don’t have your feet stuck in cement.
The S&P 500 is still hovering around “correction” territory. That means it’s down nearly 10% from its most recent high in late July. And it has headed lower for the past three months.
That sounds terrible on its face.
But historically, these “near correction” events only last for about four months. So it’s possible that we’re already nearing the other side of the current downturn.
We’re also facing the period of general “autumn panic” in the market. Put simply, it’s not unusual for stocks to blow off steam and round out the year on a higher note.
The world is a complicated place today. So is the market, its sectors, and its subsectors.
But you need to make sure you’re following all these sectors and subsectors individually. They’ll each have their own opportunities and hazards in the coming months.
I’ll be watching everything closely. And I suggest you do the same.
Good investing,
Marc Chaikin