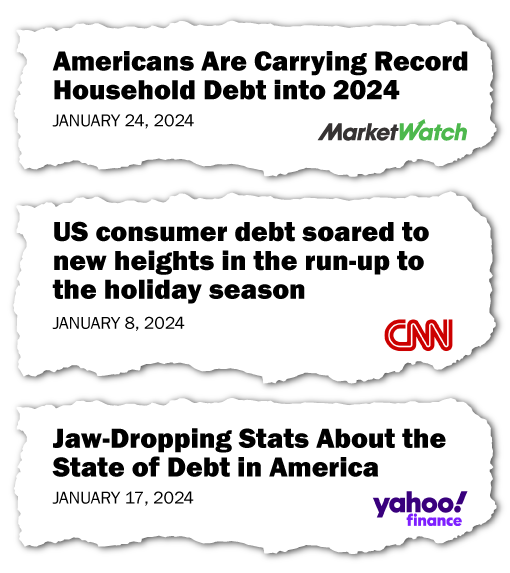
You’ve probably seen headlines like these in recent months…
They sound ominous. And it’s hard to resist clicking on them.
But as I noted last week, the doomsday narrative about U.S. consumer debt isn’t true.
As a reminder, the numbers show that the debt picture hasn’t changed much in America over the past 20 years – especially when it comes to the proportion of mortgage and non-mortgage debt.
The most surprising fact is that credit-card debt has fallen as a percentage of total debt over that span.
In that essay last week, I discussed the different types of debt U.S. households are carrying.
Today, I’ll focus on the “big picture” by examining the amount of debt out there. And we’ll see if it’s as bad as the headlines claim.
Let’s start with the scariest number…
As of the start of 2024, U.S. household debt is a whopping $17.5 trillion.
That’s a mind-boggling number. Even if you change “trillion” to “billion,” it’s hard to fully wrap your head around a figure like that.
And the fact that it’s an all-time high is concerning.
But in order to compare it with historical levels, we need to consider the effects of inflation.
As you surely know, inflation weakens the value of the U.S. dollar over time. That’s why we need to adjust for inflation when looking at historical numbers like these.
In the chart below, you can see the total amount of U.S. household debt over the past 20 years – adjusted for inflation…
There are two key takeaways from this chart…
First, when we account for inflation, household debt levels are not at a record high.
As you can see, the record high happened back in 2008. Back then, households were sitting on roughly $18.3 trillion in debt – measured in 2024 dollars.
The current $17.5 trillion number is about 4.2% below the all-time high.
Now, I wouldn’t necessarily call that “good news.” But it contradicts the media narrative that consumer debt is completely out of control.
The second thing that stands out is the difference between the debt “run up” in the 2000s versus the current uptrend.
Notice how consumer debt exploded from 2003 to 2008. There was a 50% surge in less than six years. (Notably, it fits the narrative that folks were on a homebuying spree – and racking up massive mortgage debt – leading up to the global financial crisis.)
To put that historical surge into perspective, total household debt is up just 19% from the bottom in 2013. And the recent increase has been much more gradual. A 19% jump over 10-and-a-half years works out to an increase of less than 2% per year.
Now, I don’t want to dismiss the fact that certain folks are struggling…
For example, data from the New York Federal Reserve shows that about 5% of consumers owe money to a third-party collection agency. That’s the lowest percentage in 20 years.
Meanwhile, those debtors owe an average of around $1,600. That’s the highest in 20 years.
In other words, it’s a small group of folks who are struggling mightily.
Otherwise, the data shows that bankruptcies and foreclosures are sitting near multidecade lows. There has been an uptick in delinquency rates for credit cards and auto loans lately. But that’s normal when interest rates rise sharply (as they have over the past two years).
It’s also worth noting that, even after creeping higher over the past years, credit-card delinquencies are sitting well below their historic averages.
Roughly 3.1% of credit-card accounts are 30 days (or more) overdue. By comparison, the average since 2000 is over 3.4%. And the average is above 3.7% if you include data going back to 1991.
Again, I need to acknowledge that a lot of folks are struggling to pay their bills without going deeper into debt. It’s a painful situation.
But overall, U.S. consumers are not drowning in debt. It’s not even close.
And when it comes to the scary headlines in the mainstream media, I’ll repeat what I said last week…
Remember that the media narrative around consumer debt is simply that – a media narrative.
Good investing,
Vic Lederman

