I’ve written a lot about what history tells us regarding stocks in presidential-election years…
Stocks have rallied from June through December during 16 of the past 18 presidential-election years. And they’ve produced an average gain of 10% in those years.
A recent study from Bank of America zeroed in on this idea even further…
According to the financial-services giant’s data, June through August is the strongest period during these years. Since 1928, the stock market has been up over this three-month stretch 75% of the time – with an average gain of 7.3%.
In short, the data meshes well with the average price cycle in a presidential-election year.
The election-year blueprint is happening once again.
To that point, you might recognize the chart below from one of my recent presentations…
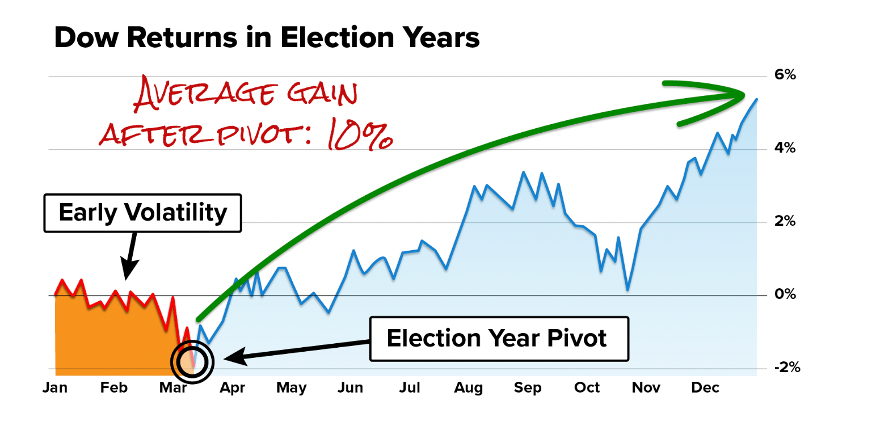
Sure, this year’s pivot happened a little later than the historical average of late March. But the pattern is similar. And importantly, that sets us up for a big rally in the months ahead.
We’re now getting past the historical “rough patch” at the start of a presidential-election year. And we’re entering the period when stocks begin to soar. That’s great news.
We’re seeing the market’s coming rebound in another way, too. Take a look…
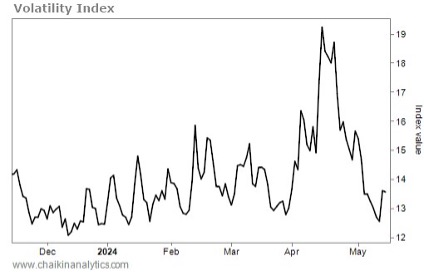
That’s a six-month chart of the Chicago Board Options Exchange’s Volatility Index (“VIX”).
The VIX is the market’s so-called “fear gauge.” It uses options to measure the expected future volatility in the S&P 500.
As you can see, the VIX spiked to nearly 20 in April. That makes sense…
The S&P 500 Index tumbled 5.5% in roughly a month around that time. And the other major indexes fell, too.
But now, the VIX has cooled off. That tells us investors aren’t feeling as skittish.
In other words, we just passed through a period in which investors feared a lot of volatility. That’s not the case today. As a result, investors will likely start making more “bullish” bets.
Here’s my take on how everything will play out in the months ahead…
Inflation will moderate over the rest of 2024. The economy will peak in the second quarter. Then, with just enough softening in the third quarter, the Federal Reserve will cut interest rates around the upcoming election.
Sure, fears of “stagflation” aren’t completely gone. (If you’re not familiar, stagflation is the idea that we’ll continue to see persistent inflation without any economic growth.)
But here’s the thing…
The Atlanta Fed’s GDPNow model currently forecasts a robust 4.2% increase in second-quarter gross domestic product. That takes the “stag” out of the equation. Or as Fed Chair Jerome Powell recently put it, “I don’t see the stag, or the ‘flation.”
If the economy stays strong and U.S. consumers continue their spending spree, stocks should move sharply higher. That should happen even if the Fed puts off any rate cuts until after the election in November.
The S&P 500 could experience a “Melt Up” over the next three months. So I’m bumping up my target range for the rest of the year…
On the lower end, my new target range for the S&P 500 is 5,600. And if the Fed cuts rates a couple of times, I believe a post-election rally could carry the index up to 6,000 this year.
My overall stance is simple today…
I’m still “bullish” on stocks for the rest of 2024 – and beyond. Don’t miss this opportunity.
Good investing,
Marc Chaikin