“I don’t care.”
Those are among the three most important words an investor can say.
Investing is a battle against the most formidable of enemies: the unknown future.
We can’t see this enemy. We don’t know what it will hit us with. The best we can do is weigh probabilities.
That’s hard. So we have to devote maximum effort to the challenge.
We must avoid the wasted effort of fighting battles that we don’t really need to win.
In The Art of War, Chinese military general, strategist, and philosopher Sun Tzu wrote that “to fight and conquer in all your battles is not supreme excellence.”
In other words: “Choose your battles.”
Accordingly, I don’t care what the overall stock market will do.
But I deeply care about identifying the best stocks in the best industries.
That’s a battle worth winning. Better still, it’s a battle we can successfully wage using an enhanced Power Gauge strategy.
Let me explain…
When we discuss stocks, we act like “the market” is a singular entity.
“The market will go up,” we say, or “the market will go down.”
But those are generalities. Just because the S&P 500 Index as a whole has performed well over the past six months doesn’t mean every stock within it has.
To actually judge how stocks are doing – and select only the best ones – we must break the market down into individual sectors.
The following table shows how various S&P 500 exchange-traded funds (“ETFs”) have performed over the past six months. Notice how dramatically zeroing in on the right (or wrong) sectors alters your returns…
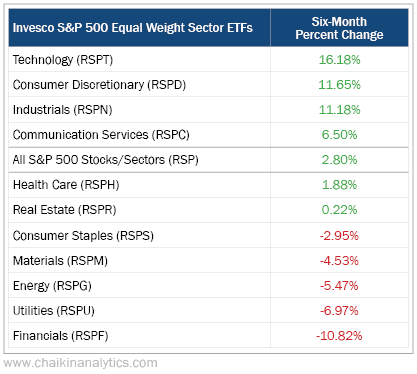
Of course, each sector contains several industries. And the best-to-worst gap widens when we focus on these.
Consider, too, that there’s more to the market than the approximately 500 stocks in the S&P 500. The Power Gauge presently ranks 5,199 stocks.
Over the past six months, the average price change among those stocks was 3%. But we can’t treat the Power Gauge universe as a singular entity. When we break it down into industries, we see a wide discrepancy…
The best industry we cover, passenger airlines, climbed an average 37% over the past six months. The worst industry was industrial conglomerates, which declined 20% during the same period.
As you can see, identifying the best industries makes a significant difference for your investing returns.
We accomplish this through our Power Bars presentation.
Green bars show the number of favorably ranked stocks in an industry. Yellow bars show the number of stocks with a neutral ranking. And red bars show the number of poorly ranked stocks.
The Power Bar Ratio is the number of green stocks as a percentage of green and red stocks.
But we can do more…
Instead of just picking the highest-ranked stocks in the Power Gauge universe or the industries with the best Power Bar Ratios, we can do both. We can zero in on the best stocks within the best industries.
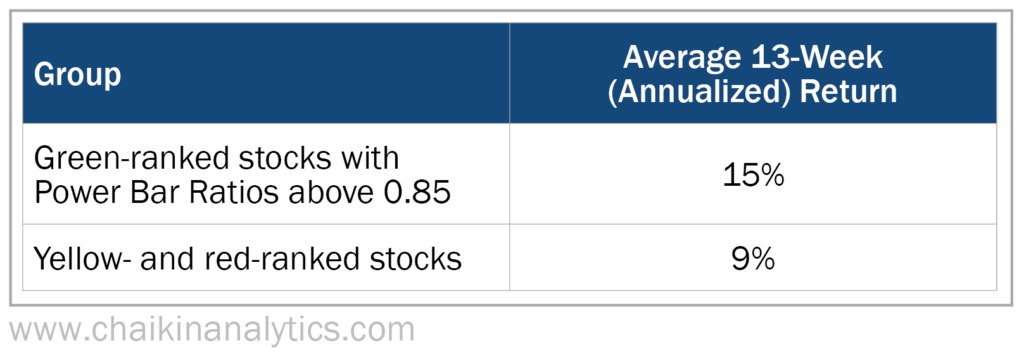
We tested this over 10 years by comparing green-ranked stocks in very strong industries with the rest of our Power Gauge universe.
Results show that stocks with Power Bar Ratios of 0.85 or higher produced annualized returns of 15% during an average 13-week holding period. All other stocks returned 9% during the same period…
That’s why when it comes to the overall stock market, we boldly proclaim, “I don’t care!”
Instead, we use our tools to focus on identifying the best stocks in the best industries that can deliver the best returns. That’s how we’ll win the battle against the unknown future.
Good investing,
Marc Gerstein