Here at Chaikin Analytics, we believe in both fundamental and technical analysis.
The reason is simple…
The stock market is irrational.
A company with good fundamentals can beat Wall Street’s estimates. And yet, its stock will still go down for some unclear reason.
That happens all the time in the market. And it’s where technical analysis comes in…
More specifically, we rely on a technical indicator known as “relative strength.”
This indicator is based on price movement. Our Power Gauge system measures the relative strength of the more than 5,000 stocks in its universe against the S&P 500 Index.
If a stock has a “bullish” rating but is doing worse than the S&P 500, it’s likely not a good buy. In that case, it would make more sense for us to just invest in the index itself.
But importantly, following our relative strength indicator can give us an edge…
Take appliance maker Whirlpool (WHR), for example…
The company has beaten its earnings estimates in three straight quarters.
But as an investor, I wouldn’t get near Whirlpool’s stock today…
Even though the fundamentals look good, the other piece of the puzzle – the technicals – is telling us something different. Whirlpool’s relative strength is weak. Take a look…
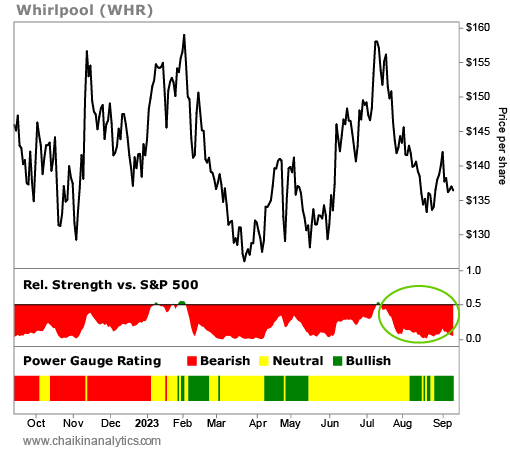
Whirlpool closed 2022 at about $141 per share. Today, it trades at around $136 per share.
In other words, in the middle of a bull market… Whirlpool’s stock has lost value.
It doesn’t matter how good the fundamentals are. You’re in trouble if the market doesn’t agree with you.
Based on the fundamentals, Whirlpool is a great company right now. But its stock isn’t moving up. So in this case, it’s the perfect candidate for your watch list.
Now, consider what’s happening with computer maker Dell Technologies (DELL)…
Dell also beat Wall Street’s earnings estimates in every quarter this year. So we know it’s fundamentally solid. And importantly, Dell’s relative strength is strong. Take a look…
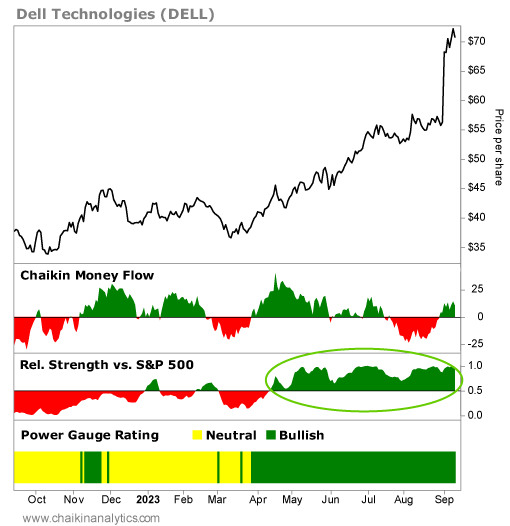
Notice that Dell’s relative strength was still negative earlier this year…
In late March, the stock’s Power Gauge rating flipped to “bullish.” Then, the Chaikin Money Flow indicator moved into the green zone. And finally, its relative strength turned positive.
Here’s the kicker…
Since that trend change occurred in April, Dell’s stock is up around 70%.
That’s why we believe in both the fundamentals and the technicals at Chaikin Analytics. When we use them together, we can gain an important advantage over other investors.
It’s the best way to succeed in an irrational market.
Good investing,
Pete Carmasino