Editor’s note: We’re switching things up today at Chaikin Analytics…
In short, we’re sharing an essay from our corporate affiliate Stansberry Research.
Porter Stansberry, the company’s founder and namesake, was away from the business for about three years. But he has returned with an urgent message for anyone who will listen.
Related to that, this essay from editor Corey McLaughlin first appeared in the Stansberry Digest last Wednesday. In it, Corey explains part of the “why” behind Porter’s message.
Folks, we can’t sugarcoat it…
Some of the details discussed in this essay are grim. And the message is a little different from our usual tone. But we believe it’s something you need to hear and understand…
Let’s ignore stocks for a day…
We won’t talk about using the stock market as a wealth-generating tool today. We’ll ignore the S&P 500 Index, the Dow Jones Industrial Average, and the Nasdaq Composite Index.
Rather, we want to tell the true story about our nation’s economic health. And we’ll use a single number to do that. This number shows what’s really going on for most Americans…
Think of it as the “Net Worth Index.”
Stansberry Research founder Porter Stansberry has tried to get this message across to everyday Americans for more than a decade. Some of the details have changed over the years, but the climate remains the same.
In fact, it’s radically worse in some cases…
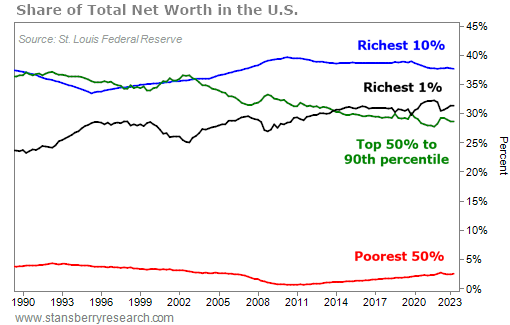
Now, you could calculate a Net Worth Index in a lot of ways. But today, we’ll focus on comparing the share of net worth held by the richest 1%, 10%, the middle class, and the poorest 50% in the U.S.
I want to draw your attention most to the trend among the richest 1%, compared with the group that makes up the “top 50% to 90th percentile” (which is roughly the middle class).
The richest of the rich are the only group that has gotten richer in the past 30 or so years.
Meanwhile, almost everyone else has gotten relatively poorer. And the middle class has suffered the biggest decline. You can see what I mean in the following chart…
The richest people in this country have been getting a larger share of the wealth for decades. And as you can see, most Americans have been largely unable to keep pace.
It’s also interesting to note that as I put this chart together, I found out the Federal Reserve stopped reporting the share for the “richest 1%” in the first quarter of 2022.
Porter and many of our editors at Stansberry Research have been writing about the financial and cultural dangers of an ever-increasing wealth gap for years. They’ve warned about the potential consequences.
At times like these, the frustrations of the American public have tended to boil over.
Worst of all, these consequences seem to be playing out in real time…
The “easy money” policies of the past might’ve been good for folks with access to Wall Street. But the American economy we have today is largely unsustainable.
Now, with soaring interest rates, it’s facing a cost of money the nation hasn’t seen since before the last financial crisis. And the problems we’ve touched on today will catch up with everyone’s wealth eventually – no matter how well off you are, rich or poor.
According to Porter, they’re coming to a head right now.
Good investing,
Corey McLaughlin
Corey’s note: If Porter is right, the next several years could be challenging for everyday Americans and investors. But if you’re reading this message, you have one advantage…
This volatile period will be easier to endure for folks who prepare the right way. It could even lead to the kinds of opportunities that have been scarce in the age of easy money.
Knowing where the fallout will spread – and owning the right assets – is going to be critical.
That’s why Porter came forward last week to share his controversial warning and reveal one of the top strategies he recommends right now. Watch the full interview before it’s too late.
