Folks, we can’t deny it at this point…
The stock market is several months into its recovery from its 2022 lows.
The S&P 500 Index is up about 9% this year. And the benchmark stock index has gained roughly 17% since it bottomed last October.
Tech stocks are surging even more. The tech-heavy Nasdaq Composite Index is up around 25% this year. And it just passed 13,000 for the first time since last August.
In “normal” times, most investors would take those types of returns. After all, you can typically expect to make roughly 7% per year in the broad market over the long run.
So we’re seeing outperformance in the stock market through the first five months of 2023. And that’s true even if last year was a wipeout for a lot of folks.
Despite this clear recovery… fear and uncertainty are still in many investors’ minds.
A lot of people are just “waiting for the other shoe to drop” when it comes to the economy. And in turn, they’re still not ready to put their money back to work in stocks.
That’s even true on Wall Street right now. It’s plainly telling us where it feels safest – and where it doesn’t.
Today, we’ll take a closer look at that idea. And more importantly, we’ll see what it means for our investments in the coming months…
We’ve established that “the stock market” is doing well so far this year.
But the thing is, I’ve always seen the stock market as more than just a single entity. It’s made up of various sectors, segments, and industries…
Each sector, segment, and industry has its own unique features and priorities. And together, they make up what we broadly call the stock market.
With that said, I prefer not to use such a broad term as the primary measure of how things are going. It’s simply too coarse.
I’m not saying we need to do a deep dive into every sector, segment, or industry to get the full story. But we can peel back a layer or two to see what’s really going on…
Sure, the S&P 500 is up as a whole so far this year. That’s the broad takeaway. But something interesting is going on beneath the surface…
Specifically, over the past three months or so, mega-cap stocks have outperformed. The 50 largest stocks in the S&P 500 have returned an average of about 9% in that span.
But it’s a much different story with the 50 smallest stocks in the S&P 500. They’ve lost an average of more than 10% over the same period.
With the Power Gauge’s help, we can peel back another layer of the stock market…
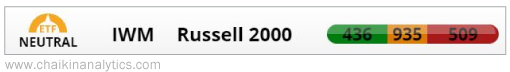
Instead of focusing on the S&P 500, we can look at small caps. We use the iShares Russell 2000 Fund (IWM) to track this group of stocks in the Power Gauge.
Unlike the S&P 500 or the Nasdaq, IWM is struggling to recover so far this year. The exchange-traded fund (“ETF”) is actually about breakeven since the start of 2023.
And here’s the important part…
The SPDR S&P 500 Trust (SPY) and the Invesco QQQ Trust (QQQ) both earn “very bullish” ratings. That means their Power Bar ratios of “bullish” to “bearish” holdings are tilted to the green side right now.
On the other hand, small caps aren’t looking too hot. IWM currently receives a “neutral” grade. And its Power Bar ratio is tilted toward the red side. Take a look…
When you combine that with the ETF’s poor performance this year, the message is clear…
Wall Street is happy in tech and with mega-cap stocks. But it’s not yet confident in the small-business engine behind the market.
Keep that in mind before you bet on a smaller company in the days and weeks ahead.
For now, the obvious plays are creating the “easy” returns in this bull market.
Good investing,
Marc Chaikin