It’s no secret to anyone that the technology sector is getting pummeled…
But the worst might not be over yet.
You see, one technical pattern keeps popping up on the tech sector’s chart. And it’s creating an ominous warning signal for this group of stocks.
It gets worse…
The tech sector as a whole isn’t the only thing signaling this pattern today. The same pattern is evident on the chart of one of the top holdings in the Technology Select Sector SPDR Fund (XLK), too.
It’s a dangerous one-two punch for anyone looking at tech stocks today.
Let’s get into the details…
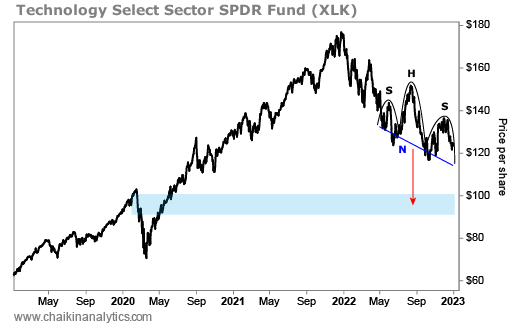
We’ll start with the chart of the Technology Select Sector SPDR Fund. As its name implies, this exchange-traded fund (“ETF”) represents the technology sector within the S&P 500 Index.
The following chart shows XLK’s performance since the middle of 2019. You’ll also notice the lines that I use to build this pattern – which is called a “head and shoulders” pattern.
Take a look…
Now, this chart might look complicated at first. But in reality, the math is simple…
Start with the down-trending line on the chart (the “neckline”). Then, measure the peak of the “head” in the pattern from the neckline. XLK’s head peaked at around $151 per share in August. And the price at the neckline is about $123 per share. That’s a $28 spread.
Now, subtract $28 from the neckline’s $123 to get the downside target. It’s $95 per share.
In other words, using the traditional head-and-shoulders pattern, XLK is signaling that another massive fall might be just around the corner. It could fall another 23% from here.
Interestingly, that fall lines up perfectly in the middle of the range that XLK created back at the start of 2020 and the pandemic lockdowns. That’s the gray box I added to the above chart.
Regular readers might know where I’m going next…
One of the top two holdings in XLKis Microsoft (MSFT). It makes up roughly 21% of the fund, which is about the same as consumer-electronics maker Apple (AAPL).
Let’s look at Microsoft’s chart…
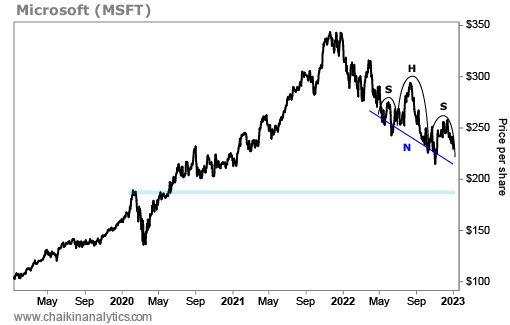
Notice the similar head-and-shoulders pattern. In Microsoft’s case, the neckline spread is $53 per share (roughly $292-per-share peak at the head minus the neckline at around $239 per share).
Using the same math, you would take $53 from the neckline price of $239 to find the downside target. That’s roughly $186 per share – or about 16% below its current price.
Where would that type of drop put the stock?
It would be right in the range of early 2020 – essentially where XLK is also pointing.
Now, that’s not too surprising. After all, as I said, Microsoft makes up about 21% of XLK. So it makes sense that they would feature similar setups.
But folks, the message here is clear…
The fall throughout 2022 from outrageous valuations doesn’t necessarily mean tech stocks are now “normally priced.” The worst part of the storm isn’t over for these stocks just yet.
The market is in a re-valuation phase right now. And the main issue is that these stocks’ prices have dropped… but earnings estimates haven’t.
If these stocks’ prices are the so-called “canary in the coal mine,” then earnings will come down next. And that could mean these stocks’ prices will drop even further.
Also, remember that interest rates are rising. And the experts are calling for additional rate hikes from the Federal Reserve this year. That’s not good news for tech stocks.
In the end, the warning signal from the head-and-shoulders pattern makes perfect sense.
Good investing,
Pete Carmasino