Today, I want to discuss a proven technical pattern that has been around for decades…
This signal already played out once this year. Back in March, it helped me warn a group of our paid subscribers about the June low on the S&P 500 Index three months ahead of time.
And now… it’s flashing another warning sign.
Obviously, folks want the bear market to end. But unfortunately, at least in the short term, this pattern signals that more pain could still be ahead…
Specifically, using this pattern, I’m seeing a potential low of around 3,300 in the S&P 500. That would be another 19% fall from the index’s current level.
With that in mind, let’s take a closer look at this pattern…
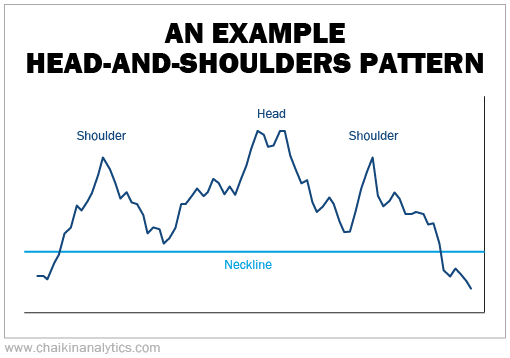
In short, I’m talking about a “head and shoulders” pattern. It’s called that because of its shape…
The head-and-shoulders pattern forms a higher-level area (the “head”) in the middle of two lower levels (the “shoulders”). And the two shoulders are similar heights and durations.
The “neckline” is at the bottom of all three areas. You can see what I mean in this basic example…
As I said, this exact pattern developed on the chart of the S&P 500 earlier this year. It allowed me to project a possible June downside level of 3,750 for some of our paid subscribers back in March.
That gave us a three-month head start over others. And we were able to prepare accordingly.
Now… the same pattern is setting up again.
It’s worth noting that this type of pattern analysis isn’t an exact science. It’s more of an art form.
But the setup in the S&P 500 today is about as obvious as you’ll ever find. Once again, it’s easiest to see what I mean on the chart…
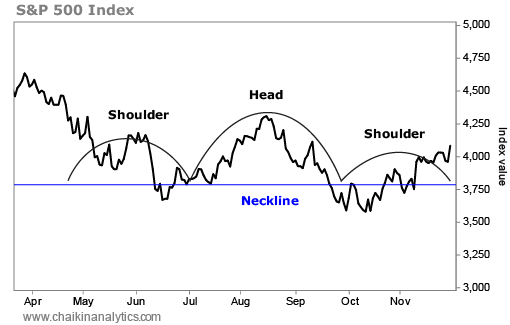
The S&P 500 is in a textbook example of the head-and-shoulders pattern today. And it’s indicating that the index could easily move down roughly 19% from its current level.
Arriving at that number is fairly straightforward…
First, you can see the formation of the head in the area of 4,300. And the neckline is at about 3,800. That’s a 500-point difference.
So the projected fall from today’s price would be 500 points below the neckline.
In other words, the market soared 500 points above the neckline to reach its head. And now, there’s a very real possibility that it will fall 500 points below the neckline as well.
A move like that would take the index down to 3,300. Again, that’s about 19% below its current level.
It’s also worth noting that 3,750 was my first downside target for the S&P 500 back in June. But in reality, the index fell to around 3,675 that month. And it went even lower in October.
So depending on the speed and the catalyst, even lower levels are possible.
Remember, this isn’t an exact science. And it’s just a projection – not a prediction. After all, we can’t know for sure what will happen in the future.
If we’re lucky, the market’s pre-pandemic high of around 3,380 could serve as a “support” level. But consider yourself warned that a roughly 19% drop isn’t out of the question.
The head-and-shoulders pattern is one of the oldest technical setups in the book. So when it forms – especially as clearly as this example – we want to pay close attention to it.
For now, stay cautious. But also remain alert and engaged…
If the S&P 500 does fall down to the level that this pattern suggests, it would be a serious buying opportunity. It might even be a generational low.
So if that happens, be ready to act quickly.
Good investing,
Pete Carmasino