I bet you don’t spend much time thinking about the Baltic Dry Index…
After all, as its name suggests, the index measures the shipping costs for dry goods.
Dry goods are raw materials that trade in bulk. They include things like iron ore, fertilizer, coal, cement, and grains. Altogether, they’re lumped into the “commodities” category.
Most days, folks just don’t care about the costs to ship these commodities around the world. But when we’re in a recessionary environment like today… this information is critical.
Ordering these materials is part of the initial stages of global commodity trading. So when the index is elevated, it’s inflationary. On the flip side, lower levels can mean lower inflation.
And put simply, freight-shipping costs are crashing right now…
This plunge tells us that demand is falling. In other words, people are buying less. And in turn, companies are buying less.
With that in mind, you might interpret crashing shipping costs as a good thing. It could signal that we’ve passed “peak inflation.”
And while that might be true, there’s a downside…
In short, the sharp move down is now signaling an earnings recession.
This story has played out before. And it has big consequences for the stock market…
Folks, the issue is simple…
Severe slowdowns in orders are happening. That’s producing slack in the shipping industry and lowering prices. And at some point, this shift will further hurt stocks.
A similar situation occurred before the 2008 bust. Back then, the Baltic Dry Index actually gave two signals…
First, after peaking at about 11,000 in October 2007, it plunged around 50% through January 2008. The S&P 500 Index got the inflation signal… and fell by about 18%.
Then, starting in May 2008, the destruction was much worse. The Baltic Dry Index dropped from a peak of around 11,800 all the way down to 700 – a 94% decline in seven months.
Through the second half of 2008 and into 2009, the S&P 500 sold off significantly. It fell more than 50% from about 1,430 in May 2008 down to its bottom at 676 in March 2009.
Recently, the same type of drop in shipping costs started unfolding…
The downturn in the Baltic Dry Index began at the end of May. The index peaked at roughly 3,375. And it’s around 1,175 today – a 65% decline in three-plus months. Take a look…
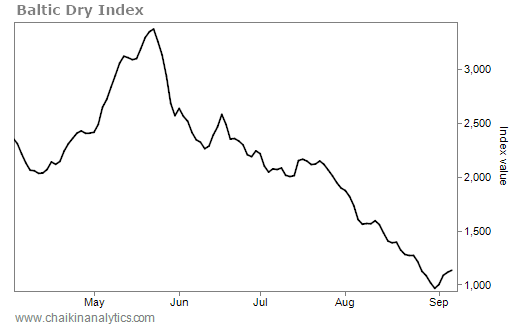
That’s a huge drop. And based on history, it tells us that the S&P 500 could fall further in the weeks and months ahead.
It’s the leading indicator nobody cares about. But it gives us a “heads up” at how current orders impact the S&P 500.
In fact, this shift is already showing up in the earnings reports…
According to a FactSet research report last week, the decline in the earnings estimates in the first two months of the third quarter was significant. It eclipsed the five-, 10-, 15-, and 20-year averages.
And it gets worse…
Companies are also decreasing their estimates for the fourth quarter. FactSet’s data showed that the average decrease was 3.5% over the same reporting period.
As investors, it’s essential to keep our eyes on less-followed indicators – like the Baltic Dry Index. Sometimes, we just need to remember to get back to the basics…
Fewer orders mean lower shipping costs. And in turn, that means lower earnings. Even if it’s something as boring as dry goods… it’s the reality of the market we face today.
Good investing,
Pete Carmasino