Two major indexes just made history…
The benchmark S&P 500 Index gained 5.5% last Thursday. And the tech-heavy Nasdaq Composite Index did even better. It climbed 7.4% that day.
Neither index had surged that much in one day since 2020. And according to Dow Jones Market Data, it was the best “CPI day” performance for both indexes in history.
By now, we’ve beaten you over the head about why it happened…
The latest Consumer Price Index (“CPI”) update came in lower than expected. In turn, “hopium”-addicted investors once again flooded into the market.
These folks want to believe the worst of the bear market is behind us. And I get it…
After a terrible year in the markets, any glimmer of hope is refreshing.
But the reality is that the market still faces considerable headwinds. So as I showed you on Monday, the latest bear market rally is likely more fragile than most people think.
However, that raises another critical question for us as investors…
How will we know when the pain is over?
Today, we’ll cover a simple indicator that will help us answer that question…
In short, we need to pay attention to the S&P 500’s 200-day moving average (“DMA”).
Don’t worry if you’ve never heard of this indicator before. It’s easy to understand…
The S&P 500’s 200-DMA is often shown with a secondary line on the chart. It tracks the index’s average closing price over its previous 200 trading days (roughly 40 weeks).
And importantly, it’s a powerful tool for defining a long-term trend. When the S&P 500’s 200-DMA is rising, it’s a “bullish” sign. And when it’s falling, it’s a “bearish” sign.
The 200-DMA also helps us spot other key levels. It can show us where the S&P 500 will likely struggle to keep rising (resistance) or where it will likely stop falling (support).
Unfortunately for all the hopium addicts, the S&P 500 is about to bump into a key level of resistance at its 200-DMA. Even worse, its 200-DMA is still falling. Take a look…
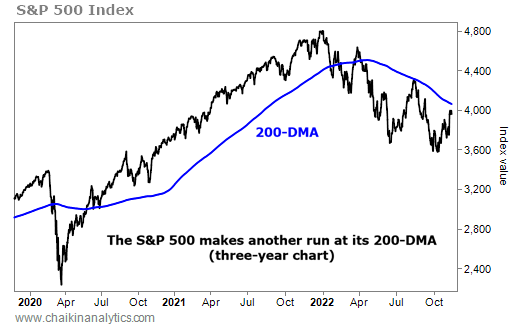
You can see that the S&P 500’s 200-DMA is currently around 4,070. That’s roughly 3% above the index’s current level (about 3,950).
Next, notice that the S&P 500 already failed twice to break through resistance this year…
In March, the index briefly crossed above its 200-DMA. However, the move didn’t last long. Then, in July, it approached the 200-DMA again. But it quickly reversed course and sold off.
Now, another approach is underway. And we’ll need to watch what happens from here…
It’s tempting to believe that the cooling inflation data and Thursday’s big move higher signaled the end of the pain. But it’s still too early for us to know one way or the other…
It would be a great first step for the S&P 500 to break through its 200-DMA and stay there. Then, we would want to see the 200-DMA turn higher.
That would be a “bullish” move. And it would likely signal the end of the bear market.
However, if the S&P 500 fails to break through its 200-DMA yet again, we should expect more pain.
If nothing else, we need to brace for a lot of volatility through the end of the year. As the S&P 500 continues to flirt with its 200-DMA, stocks will likely swing wildly back and forth.
So for now, stay patient. Follow this key indicator. And don’t get caught being too greedy.
Good investing,
Marc Chaikin
Editor’s note: Marc believes the market will remain “very tricky” into 2023. But if you know what’s coming, he thinks it could end up being the best year of your financial life…
Before January 2, Marc urges investors to move their money into a little-known “vehicle” that’s 50 years in the making. It could help you make massive gains as everything unfolds.
Marc recently shared all the details in a special online broadcast. Click here for the full story.