Always know which way the wind is blowing in the markets…
Folks, if you don’t know that, you’re setting yourself up to fail.
I worked as a mutual-fund manager for two decades before joining Chaikin Analytics. And as we discussed yesterday, I spent 18 of those years alongside Wall Street legend Marty Zweig.
Importantly, Marty always knew the importance of which way the wind was blowing.
By that, I’m talking about the “broader trends” at play in the market. If you couldn’t define the broader trends, you didn’t place the trade.
That sounds basic. But it’s a huge problem for millions of individual investors…
Many folks simply ignore this investing fundamental. They buy into market segments that are trending down… or they mistakenly believe the broad market indexes show the direction of the wind.
That’s a critical mistake. If you aren’t careful, it can wreck your portfolio.
Maybe you’ve heard the talking heads on financial-news networks say that “it’s a stock picker’s market” at one time or another. I get a kick out of that one every time…
On Wall Street, it’s always a stock picker’s market.
The reality is that you can always find specific bull markets somewhere within the broader market. And you can always find specific bear markets somewhere, too.
Both are happening at the same time almost every day.
The key to success is knowing which specific bull markets to invest in – and which to avoid. If you can do that, you’ll be much better off than the vast majority of individual investors.
In short, you need a system to identify and measure these bulls and bears. And in today’s essay, I’ll explain exactly why that’s more important right now than ever before…
Traders use many different technical indicators to judge the overall “health” of the market. One simple indicator is the 50-day moving average (“DMA”).
That’s just a fancy term for the average price of a stock over the past 50 days. And “moving” means it updates each day.
If a stock is above its 50-DMA, it’s in an uptrend. If it’s below its 50-DMA, it’s in a downtrend.
Technical traders add up the total number of stocks trading above their 50-DMAs. Then, they can compare that figure with the number of stocks trading below their 50-DMAs.
When more stocks are trading above their 50-DMAs than below them, the market is likely up. And when more stocks are trading below their 50-DMAs, the market is likely down.
It’s a quick way to see how many individual stocks in the entire market are in a “bull” or “bear” trend at any given moment.
However, this percentage almost never goes above 90% or below 10%. Take a look…
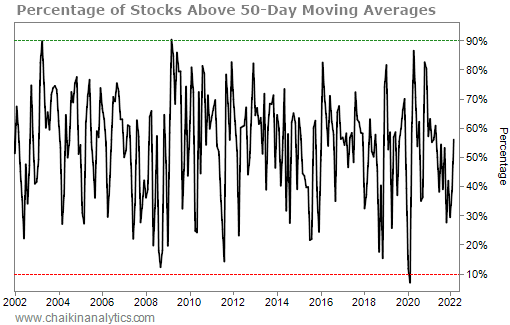
We’re looking at 20 years of data in this chart. And as you can see, this indicator only dropped below 10% once in that span – in the early days of the COVID-19 pandemic.
That’s interesting, folks. It shows us that the market is not a homogeneous block.
Thinking about it that way will blind you.
Instead, you need to realize that this indicator rarely ever swings all the way in one direction or another. It’s usually in the middle somewhere. And Wall Street pros base their careers around this truth…
There’s nearly always a bull market somewhere.
Everyone knows that growth in the economy changes over time. Sometimes, the economy is booming. And sometimes, things are a little more challenging – like right now, perhaps.
It’s all part of the “business cycle.”
Every market segment reacts differently to what’s happening with this cycle. Depending on what’s going on, some segments will do well. And at the same time, others will struggle.
In other words, these market segments rotate in and out of favor with investors.
Importantly, professional investors often use the business cycle to determine how to position their portfolios. This strategy is sometimes called taking a “top down” approach.
First, these Wall Street pros look at the state of each specific market segment. Then, they identify the stocks that offer the best opportunities within the best-performing segments.
The process of moving from one market segment to the next drives “market rotation.”
Fund managers and other Wall Street pros don’t keep their money in one place. They want to maximize their clients’ gains. So they move money from one area of the market into another. They sell stocks all the time to buy the next “best of the best” batch.
Fortunately, these days, individual investors like you can be just like the pros…
It used to be nearly impossible for individuals to even see what was happening at this level. You needed to own a Bloomberg Terminal… subscribe to FactSet’s data and software program… or pay for some other extremely expensive financial-reporting system.
But Chaikin Analytics founder Marc Chaikin helped change that with the Power Gauge…
This innovative, 20-factor system helps folks see the market’s rotation in real time. It provides individual investors like you with access to institutional-level data. Within the 20 factors, you can also see exactly what these Wall Street pros are doing with their money.
And it starts with the same approach that Marty used…
Marty was truly a top-down manager. He believed it was critical to understand the state of the economy in order to make good investment decisions.
You need to know which way the wind is blowing.
Yesterday, I shared Marty’s first “secret” with you. Every successful investor must follow a repeatable process, no matter what’s going on in the world.
Today, we’ve covered another one of Marty’s secrets. You need to buy stocks in the “best of the best” market segments at any given moment. (And you need to avoid the “worst of the worst” segments.)
Now, more than ever, you need to know where to look. You’ve likely noticed that something feels off in the markets today. And your gut instinct is correct…
We’ve entered an unusual time in the markets.
It’s not unprecedented, though. In fact, it’s one that Wall Street pros live for…
The direction of the wind is changing. And we’re in the midst of a special kind of rotation.
It’s a type of market rotation that will help many Wall Street pros make billions of dollars in the near future. But the thing is… it’s also one that you have the power to participate in.
That’s why Marc is putting the finishing touches on a big event…
It will take place TONIGHT, March 30, at 8 p.m. Eastern time. Marc will explain exactly what’s going on behind the scenes in today’s tumultuous market. And importantly, he’ll show you how to get the highest returns out of what’s unfolding right now…
Just looking for good stocks isn’t going to cut it anymore. You need to make sure you have a repeatable process. And you need to be looking for the “best of the best” opportunities.
According to Marc, the next 90 days could determine your wealth for the next decade.
Again, Marc will cover all the details for FREE tonight. Plus, everyone who attends will get the name and ticker symbol of the No. 1 worst stock he believes you should sell right now… as well as the No. 1 stock he recommends you buy. Save your spot right here.
Good investing,
Carlton Neel