It’s basic human nature to fear heights…
Now, I’m not talking about “acrophobia.” That’s an intense, almost irrational fear of high places. It can be debilitating – and even dangerous if panic sets in at the wrong time.
Rather, I’m referring to a more common fear called “visual height intolerance” (“vHI”).
One out of every three people suffers from vHI. You might not even realize that you do…
Have you ever felt uneasy for a second while looking over the ledge of a balcony? What about looking outside the car window while driving up the side of a mountain?
In short, vHI is the sinking feeling in your stomach as you go up higher than you’re comfortable with. You feel like you’re losing your balance or you’re about to fall over.
When the feeling is strong enough, it can make you want to turn around and go back down.
Many investors also suffer from vHI…
You see, when the market starts surging, they get scared of heights. They think stocks can’t keep going up. And they start getting the sinking feeling that a reversal is coming.
But as I’ll explain today, that’s a mistake…
When the market turns up, a lot of investors worry that they’ve missed the boat. They think prices have already gone up too much – so they can’t keep going even higher.
Essentially, these investors are suffering from vHI.
Many folks are falling into this trap today…
The following chart shows the S&P 500 Index’s performance since its October 2022 bottom. The index has mostly gone up over that span. Take a look…
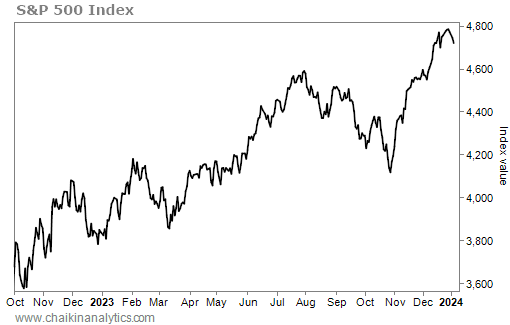
The S&P 500 is up 32% in that span. That’s a bull market (a gain of 20% or more from its low). And despite some pullbacks, the uptrend has gone on for about 14 months so far.
So now, the question is…
Does that mean stocks can’t go even higher?
No, of course not. Even better, the data tells us to overcome any fears…
I recently looked at all the S&P 500’s bull markets since 1957. And based on the numbers, the bull market we’re in right now still has a long way to go…
Over the past 67 years, the S&P 500 has experienced 11 other bull markets.
The shortest one only lasted a handful of months from September 2001 to January 2002. The S&P 500 climbed 21% over that span.
Meanwhile, the longest bull market stretched from December 1987 to March 2000. That’s more than 12 years. And it resulted in an incredible 582% gain for the index.
Even if we remove those two outliers, the data is still in our favor. The nine remaining bull markets lasted an average of 55 months. And they delivered an average gain of 140%.
To put those numbers in perspective, let’s turn back to the current bull market…
It’s only 14 months old. And again, the S&P 500 is only up 32% up from its low.
That means selling today or choosing to stay on the sidelines is a mistake. If you’re scared of the market’s current heights, you could be leaving a lot of money on the table.
If you want one more piece of proof, look at the Power Gauge…
Regular readers know we track the S&P 500 through the SPDR S&P 500 Fund (SPY). And as you can see in the following screenshot, our system remains “bullish” on SPY right now…
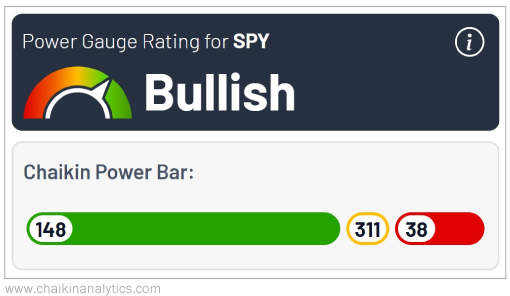
Put simply, history tells us that this bull market is still in its early stages. And the Power Gauge agrees.
So don’t fear new highs. And don’t let little dips on the way up shake you out of the market.
Good investing,
Vic Lederman