Editor’s note: The new year is nearly upon us…
As we’ve explained throughout the week, the holidays are a great time to reflect on many things – including your investment approach. And we’ve done that so far this week…
On Tuesday, Marc detailed how the bear market in 1969 laid the foundation for the Power Gauge. On Wednesday, he shared all the details about a “magic key” he first learned about in the 1980s. And yesterday, he explained why pinpointing the right industries is critical.
Today, Marc will conclude our year-end holiday series with an essay that we first published on April 4. In it, you’ll see exactly how the Industry Monitor approach works…
I explained yesterday that many investors fall into the “big picture” trap…
In short, these folks use the S&P 500 Index as their barometer for stocks. And when the broad market is headed up, they simply look for the “hot stock of the day.”
Without even realizing it, investors taking this approach have fallen into the big-picture trap.
Now, don’t get me wrong…
I love ranking stocks. That’s part of the reason why I created the Power Gauge system many years ago. It helps folks know which stocks are best positioned for outsized gains in the weeks and months ahead.
And the thing is…
This approach is more powerful when we start with industries.
I applied the algorithm for evaluating individual stocks in our Power Gauge system to industries.
The Power Gauge tracks all the specialized groups I mentioned yesterday. It’s now possible to see whether entire groups of stocks are “bullish,” “neutral,” or “bearish” at any time.
In other words, instead of just predicting the performance of a single stock over the next 90 days… we can predict the performance of entire industries over the next 90 days.
We can figure out if they’re about to experience a crash – or if they’re poised for a big run higher.
This functionality is essentially our “Industry Monitor.” It’s constantly scanning every corner of the stock market – looking for signs of weakness or opportunity.
Today, I want to show you the Industry Monitor in action…
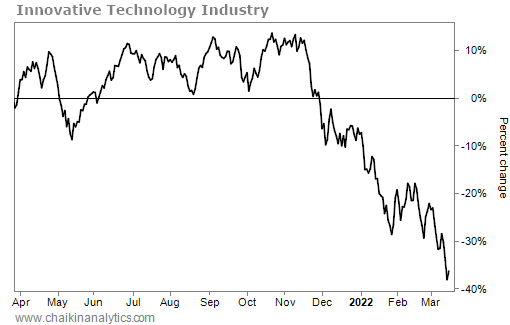
On March 26, 2021, the innovative technology industry went “bearish” in the Industry Monitor.
Back then, the mainstream media still revered Cathie Wood and her ARK Innovation Fund (ARKK) as a “breakout star” in the investing world. And some publications were calling her “the market’s new oracle.”
But if you would’ve known about the innovative tech industry’s “bearish” rating in the Industry Monitor, you would’ve known what was about to happen to some of Wood’s favorite stocks.
Sure enough, after bouncing around for months following the Industry Monitor’s warning, the entire industry quickly fell about 45% throughout last winter. Take a look…
This example alone proves the Industry Monitor’s value. But it gets better…
We can use the Industry Monitor to drill down into the best and worst stocks in each industry.
We know that individual stocks tend to do much better or worse than the industry as a whole. And within the Industry Monitor, we actually rank which stocks are poised to outperform their industry and which stocks are poised to underperform it.
In other words, we know the “best of the best” stocks in any given industry. And we know the “worst of the worst” stocks in any industry.
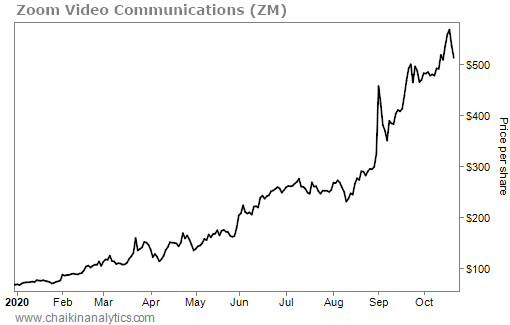
Let’s say you’re one of the many investors who bought Zoom Video Communications (ZM) after the COVID-19 crash in March 2020.
In the early days of the pandemic, you couldn’t go a day without hearing about this company. That made sense…
Zoom was leading the world’s pivot to remote work. Investors saw that. And in turn, the company’s stock skyrocketed nearly 1,000% in 2020…
But then, let’s say you checked the Power Gauge in early 2021. You would’ve seen that the system issued a “bearish” rating for Zoom. And you could’ve decided to get out of your position.
Importantly, you would’ve done that just before the stock crashed about 80% through this past spring…
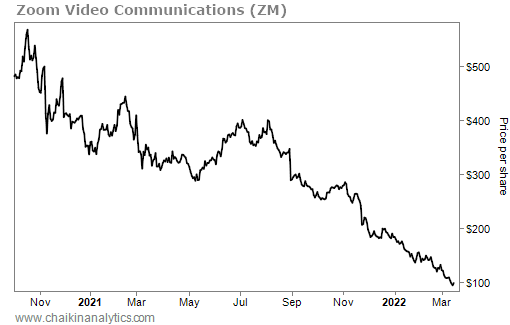
Huge relief!
Again, when it comes to the perfect time to sell any stock, the Power Gauge works. But it’s even more powerful when you add the Industry Monitor into the mix…
Zoom belongs to the innovative tech industry. And remember, the Industry Monitor would’ve issued a “bearish” warning for the entire industry in March 2021.
That’s a one-two punch of warning signs against Zoom.
Within the Industry Monitor, you can instantly see the worst individual stocks in an industry. That way, you’ll immediately know they’re the ones you need to sell as soon as possible.
Imagine knowing weeks – and often months – in advance which industries will soon come crashing down. It’s a perfect tool for any investor looking to gain an edge in the markets.
Now, I’m bringing this approach to individual investors. And the reason is simple…
Regular Chaikin PowerFeed readers know that we’re in the midst of what I call a “rolling crash.”
It’s a serious market event. And it’s going to bring unprecedented challenges to investors.
Simply put, now is not the time to keep this strategy under lock and key. Folks need to be able to easily identify the best-performing industries – and the worst-performing ones, too.
Good investing,
Marc Chaikin
Editor’s note: The markets and our Chaikin Analytics offices will be closed Monday, January 2, in observance of New Year’s Day, so we won’t publish our Chaikin PowerFeed e-letter that day. Look for your next issue on Tuesday, January 3. Enjoy the long weekend!