As a lifelong practitioner of technical analysis… I’ve heard all the rebuttals.
Some folks don’t like “magic patterns.” Others insist that history has no bearing on today’s market.
And I’ve already shared one of the earliest rebuttals with Chaikin PowerFeed readers…
Early in my career, the branch manager at my then-employer banned charts altogether.
No kidding. He thought our clients would run for the exits if they saw ’em on our desks.
Of course, that idea sounds ridiculous nowadays…
I’ve built my five-decade career around finding signals buried within charts and other technical data. And over the years, Wall Street paid big time for those signals.
Now, I’m not a crystal-ball reader. I realize that a single, magic signal doesn’t exist.
But each data point leads to a conclusion. And when the data points align, it tells us…
Something big is about to happen.
This type of situation is playing out in the stock market right now…
The benchmark S&P 500 Index just crossed a major milestone. And history tells us that this signal could lead to a return of 19% or more over the next year.
Even better, it’s a lot like some of the other “bullish” signals we’ve talked about recently…
It has a 100% win rate going all the way back to 1950.
Let’s dig in…
We’ll start with a chart of the S&P 500.
You might notice that this chart looks a little different from our normal charts…
In short, it’s a weekly chart.
That means each point on the line represents a week. These types of charts are useful for investors because they help filter out the day-to-day “noise” that can pop up in daily charts.
The blue line at the bottom is the 200-week moving average (“WMA”).
Each data point on the blue line represents the S&P 500’s average price over the previous 200 weeks. And as you can see, it dramatically smooths out the data. Take a look…
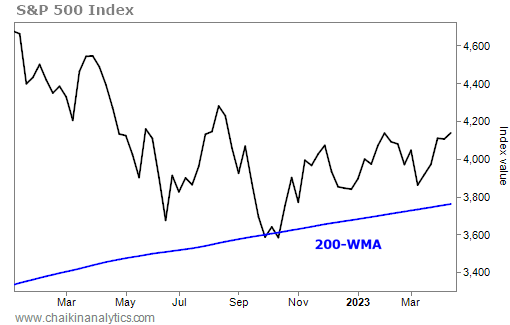
Here’s the important part…
Notice that the S&P 500 briefly dipped below its 200-WMA last October. Then, it moved above the line once again. And now, it has traded above its 200-WMA for 25 straight weeks.
This is the major milestone I mentioned earlier.
According to research from Fundstrat Global Advisors, this signal has happened 12 times since 1950. And every time, it led to positive returns over the next year.
That’s a 100% win rate.
Even better, the S&P 500’s average return after this signal is 19% over the next year.
Folks, this is an incredible occurrence…
Once again, we’re seeing a “bullish” signal with a 100% win rate. And it’s telling us that the S&P 500 could soar another 19% from here.
That is a bull market. And yet, the naysayers are still pretending that we’re not in one.
Are we guaranteed to see huge returns in stocks from here?
No, of course not. Like I said, we’re not reading crystal balls. A single, magic signal doesn’t exist.
But the market is producing a lot of strong signals right now. With the help of Fundstrat Global Advisors, we’ve just spotted another. And what it means is simple…
Now is the time to start acting on the market’s strongest opportunities.
Good investing,
Marc Chaikin
P.S. Folks, the clock just started on the biggest stock market event of this year…
In 90 days or less, the market will look vastly different than it does today. And right now, every decision you make with your money should focus on what’s happening.
That’s why I’ve put together a special presentation. I want to make sure you know what’s coming and everything you need to prepare immediately. Click here for the full details.