I’m a visual person, so I’ve always liked charts…
But back in the late 1960s, my branch manager at Shearson, Hamill wouldn’t let us have them on our desks.
You see, investment-banking clients would come through our area. And he didn’t want anyone outside the firm thinking we relied on charts – or the “technicals” – in our analysis.
It’s crazy to think about now. But that was the reality of the investment world I grew up in.
Despite that, I learned quickly that I needed charts and technicals to do my job as a broker on Wall Street. I knew that combining those tools with fundamental analysis would be the key to long-term success in the investment business.
And now, more than five decades later, the thing I was banned from using at my first Wall Street job is one of the foundational categories of the Power Gauge system…
Folks, I’ve spent my career since those early days building tools – including technical aids to help investors know the best time to buy and sell stocks. Of course, these tools also include quantitative approaches to figure out which companies are in strong positions (and which aren’t).
In short, the Power Gauge is the culmination of my life’s work…
Regular PowerFeed readers know the Power Gauge is a model that looks at 20 different factors behind every stock. This system allows us to read any stock in the market and learn instantly if we should invest or if we should walk away.
Almost no one used one specific group of these factors when I started on Wall Street in the 1960s – the technicals. They’re much more common these days… But you still have to know how to use them.
The following graphic shows the five factors in the Power Gauge’s Technicals category…
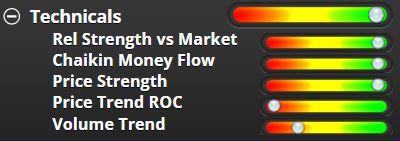
The first Technicals factor is “relative strength versus the market.” This factor shows how a company is performing compared with the overall stock market.
Before you invest in a company, it’s good to see its stock price moving higher… And it’s also good to see shares outperforming the overall market.
So, for example… if the broader market were up 10%, seeing a specific company up 20% over the same period would represent noteworthy outperformance. That kind of outperformance is a strong Technicals factor. And it’s one thing I look for before investing.
The next Technicals factor is one of the most important we track overall…
It’s called the Chaikin Money Flow.
I developed this proprietary factor many years ago. And today, it’s a built-in feature in the world-famous Bloomberg Terminal. In short, it measures the buying and selling pressures in the market…
Specifically, the Chaikin Money Flow looks at how a stock has traded over the past four weeks. When a stock consistently closes above the midpoint of that day’s trading range, it’s a positive sign.
The Chaikin Money Flow builds a number from -1 to 1 for each day. We want to see the number above zero. When it’s in that range, that’s a positive sign for the stock.
The third Technicals factor is “price strength.” This factor compares a stock’s price with its average price over the past nine months. We call this long-term average the Chaikin Trend.
The further a stock trades above its long-term trend, the better – up to a point. That’s what our fourth Technicals factor checks for…
You see, this factor is “price trend versus rate of change (‘ROC’).” When a stock gets too far ahead of its long-term trend, just like a pendulum, it tends to swing back for a bit. So this factor helps us zero in on the right time to buy a stock.
Our last Technicals factor is “volume trend.” It’s our way of comparing the recent volume of trading with longer volume trends.
Specifically, we want to see recent volume increasing compared with history. That tells us prices are moving higher in a healthy way, with more activity in the stock.
These five factors paint the technical picture for a company. They’re crucial for timing investments.
It still amazes me that Wall Street didn’t even want to acknowledge this style of analysis when I started out in the late 1960s. But here we are, more than 50 years later, and technical analysis is a foundational part of finance.
What’s more, the thing I was banned from using is forever attached to my name through the Chaikin Money Flow. And today, the technicals are a key part of investing success.
Good investing,
Marc Chaikin