Everyone knows tech stocks ripped higher last year…
The tech-heavy Nasdaq Composite Index climbed roughly 43% in 2023. And the SPDR NYSE Technology Fund (XNTK) was up an incredible 69% over that span.
At the same time, many folks are overlooking another top-performing subsector…
This subsector soared nearly 60% last year. That’s better than the Nasdaq. And it’s almost as good as XNTK.
Despite that, I bet you couldn’t name this subsector…
Many Americans are burnt out from this subsector’s narrative. They’re not interested in hearing about it. Heck, even many of the people who are participating in it… hate it.
We’re talking about the housing market – or more specifically, the homebuilding subsector.
The SPDR S&P Homebuilders Fund (XHB) has been one of the best-performing corners of the market. But folks, right now is one of the worst times since the 1980s to buy a home.
We can see that point in the data…
Analysis from Redfin showed the median income in the U.S. was about $78,000 last year. And the real estate website found that the median home price was roughly $409,000.
That means the typical American homebuyer in 2023 needed to spend more than 41% of their pretax income on monthly housing costs. That’s crazy.
In early December, Redfin called last year “the least affordable year for homebuyers” since 2012. And as part of its analysis, the company put the 41% number in perspective…
A rule of thumb in personal finance is that people should spend no more than 30% of their income on housing, but that has become less realistic due to elevated mortgage rates and home prices.
Not surprisingly, the data also helps us see that U.S. home sales are down in recent years…
The annual rate of new single-family homes sold in the country is around 590,000 (as of November). That might sound like a lot at first. But a quick glance at the following chart shows that it’s well below most of the 1990s and 2000s – and even most of the 1980s…
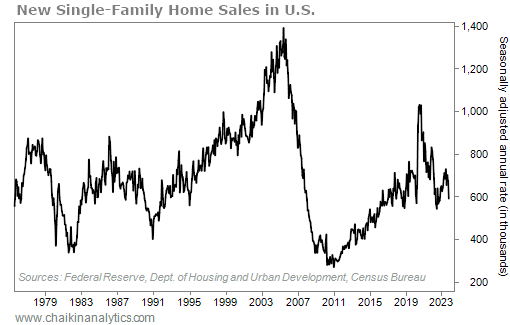
New U.S. home sales are slower. And the thing is, we’re not talking about a new trend. Home sales fell off a cliff after the housing bust. And they’ve yet to get back to their norms.
At first, you might think this trend would destroy the housing industry. After all, it seems like it would be hard for companies in this space to make money if people aren’t buying.
But there’s another side to this story…
I’m sure you’ve heard about the “housing shortage.” At this point, it’s not a secret.
New homebuilding plunged after the housing bust, too. It happened with both multifamily and single-family units.
So this time, let’s look at the two types of homes combined into one chart. That way, you can see that this problem encompasses the entire U.S. housing market. Take a look…
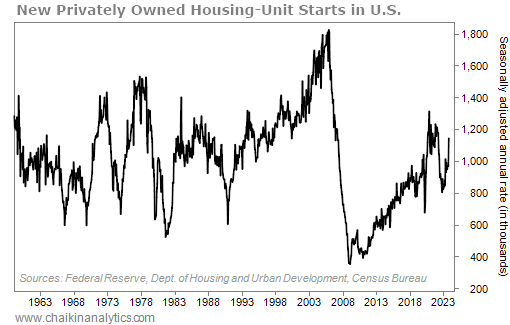
We’re looking at what the Federal Reserve calls “new privately owned housing-unit starts.” In other words, this data includes single-family homes, apartment units, and condos.
On the chart, it’s clear…
Housing production in the U.S. collapsed after the bust more than a decade ago. It fell to the lowest levels on record – going all the way back to before 1960. And here’s the kicker…
U.S. homebuilding then stayed at extreme lows for the better part of a decade.
So if you feel like you’ve been hearing about this problem for years… it’s because you have.
The U.S. housing shortage is a persistent problem. It’s so persistent that prospective young homebuyers have hoped for years that they could hold out till the next market crash…
They think that high housing prices and a tight market mean we’re living in another housing bubble. And of course, they hope they’ll get much better prices when that bubble pops.
Unfortunately, they’re dead wrong. We’re not in a housing bubble right now.
We’re short far too many homes for that. The experts debate the exact number…
The National Association of Realtors believes the market is short roughly 6.8 million units. And in recent years, the Federal National Mortgage Association put the number at around 3.8 million units.
In the end, the finer details aren’t important. The broader takeaway is all that matters…
The U.S. housing market is tight. And it’s going to stay that way for some time.
Good investing,
Marc Chaikin
P.S. In the latest issue of Power Gauge Investor, we found a “picks and shovels” way to profit from this long-term trend in housing. In fact, the Power Gauge has held a “bullish” or better rating on this company for most of the past year.
In one of the tightest housing markets ever, stocks like this most recent recommendation in Power Gauge Investor ripped higher in 2023. So just imagine how they’ll do once the housing market gets moving again.
If you aren’t already a subscriber, find out how to gain instant access to this recommendation by clicking here.