The mainstream media continues to stoke inflation fears in Americans’ minds…
Bloomberg provided the latest example. Last Friday, it published this headline…
PCE stands for “personal consumption expenditures.”
Like the Consumer Price Index (“CPI”), the PCE index measures inflation. But these metrics use different data sources and formulas…
In short, CPI measures direct consumer costs. PCE includes those costs plus the relevant business expenses for consumers’ benefit.
The Federal Reserve looks at both indicators before making any moves. But it favors PCE. So it’s noteworthy when media outlets like Bloomberg say that PCE “comes in hot.”
I won’t debate the Fed’s choice today. And investors don’t need to take sides, either.
Ultimately, we just want to know whether inflation is accelerating, decelerating, or stuck in place. In other words… we want the big picture.
And unlike Bloomberg, I’ll try to calm your fears instead of adding more fuel to the fire…
When analyzing CPI and PCE data, we need more than just a simple spreadsheet. After all, we’re looking at a massive economy with gazillions of fluctuating variables.
As a result, economic indicators like CPI and PCE rarely line up with a straightedge ruler. Rather, they’re prone to zig and zag over time…
For example, in December, PCE came in at 7.4% year over year (“YOY”). Then, in January, the YOY increase was 7.9%.
Now, I admit… if you look at nothing else, it does seem like PCE now “comes in hot.”
But that’s why we want the big picture. With added context, our perspective changes…
In January 2022, PCE was 12%. It rose to a YOY change of more than 13% the next month. But by this past November, it had shrunk to 7.3%. Then, it “swelled” slightly to its latest two readings.
Given that context, how “hot” was the latest 7.9% number really?
Before you answer, let’s add even more context…
It’s useful to compare today’s economy with the inflationary era of the early 1980s. Take a look at PCE over that period…
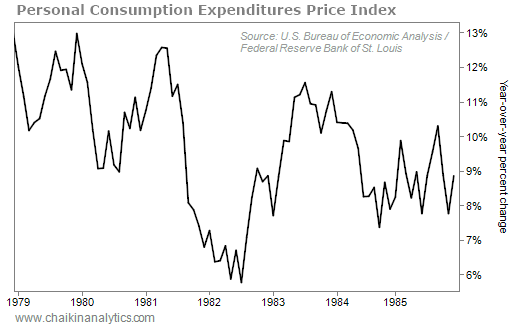
Notice how the YOY change in PCE once again spiked higher from late 1982 through early 1984. And then, it remained stubbornly high through 1985.
By using Bloomberg’s current “comes in hot” logic, that trend should’ve fueled a hefty period of reinflation. But that didn’t happen. Look at the CPI data from 1979 to 1985…
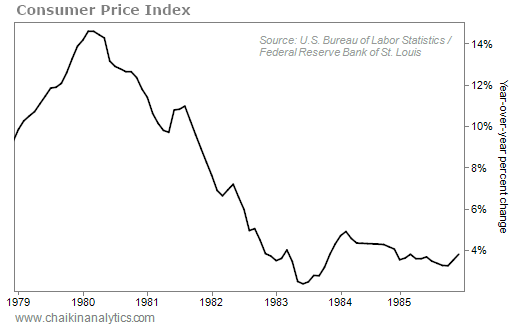
Sure, CPI ticked higher a couple times. But importantly, those moves didn’t spell doom…
In December 1986, CPI dropped to 1.2%. And despite creeping back up to 6.4% in October 1990, it mostly hovered around 2.5% for the next 30 years.
Based on all this context, the latest 7.9% PCE reading isn’t as “hot” as Bloomberg suggests.
Look, I’m not saying elevated inflation isn’t a problem…
We’ve dealt with this issue for more than a year. And we continue to deal with it today.
So I can’t promise that the next CPI or PCE update will come in lower than the previous data. As we’ve seen today, these numbers can zig and zag.
And I definitely won’t tell you that interest rates have peaked. The Fed already made it clear that more rate hikes are coming. It’s still trying to get inflation under control.
But if we hope to work through this problem, we need to understand the big picture…
That means looking beyond the media’s fearmongering for the full context.
Good investing,
Marc Gerstein