On February 28, CNBC published the following headline…
On the surface, that headline looks bad. “Weakened sharply” sounds horrible. And it seems especially concerning for anyone who recently paid top dollar for a home.
But when we dig deeper, we see that it’s not as bad as it seems at first.
In fact, the last time home prices did this, inflation tumbled.
So it’s likely better news than most folks would lead you to believe right now…
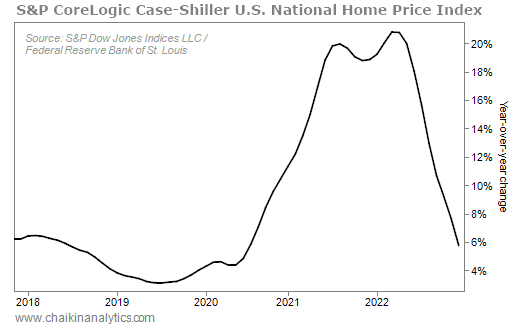
The S&P CoreLogic Case-Shiller U.S. National Home Price Index tracks prices of existing U.S. homes that are resold. It’s measured as a percentage change from the previous year. And the data is smoothed out with a three-month moving average.
That brings us to a couple key takeaways from the latest data…
First, the Case-Shiller didn’t fall in December. Prices just didn’t rise as quickly.
The 5.8% year-over-year (“YOY”) gain in December was the most tolerable increase for homebuyers since before the COVID-19 pandemic. Take a look…
There’s a lot of good in this data…
As we’ve discussed in the past, excessive sticker prices are more responsible than increased mortgage rates for our ongoing housing-affordability crisis. We know housing is in short supply. And we know that if prices fall, more folks will be able to buy homes.
Also, housing prices figure heavily in today’s big story – inflation…
You see, the two main inflation indexes – the Consumer Price Index (“CPI”) and the personal consumption expenditures (“PCE”) price index – both include housing.
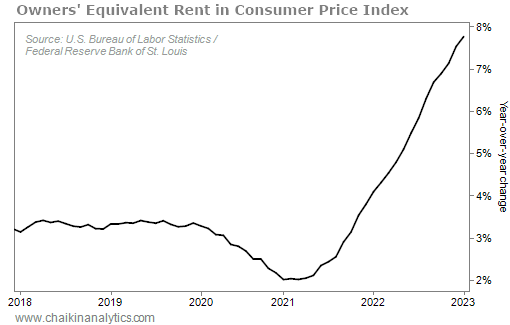
Strictly speaking, though, inflation doesn’t measure home prices. It measures “owners’ equivalent rent” (“OER”). This metric tells us how much rent an occupant who owned the home would pay if they were renting instead of owning.
As of December 2022, OER was about 25% of the CPI and 12% of PCE.
When price gains are slowing in such large components of an index, it pressures the overall index. So obviously, smaller home-price gains are good news on the inflation front.
But when it comes to OER, we’re not seeing that yet. Here’s the current trend…
That’s OK. Case-Shiller doesn’t measure the same thing as OER.
Again, Case-Shiller measures price changes in single-family homes on repeat sales. It’s a measure that tracks specific houses as they’re resold over time. That means no variations based on size and other factors.
Here’s the important point…
Since Case-Shiller tracks specific sales rather than smoothed allocations, it shows changes in trend more quickly.
In the above chart, Case-Shiller started its vigorous YOY climb in the summer of 2020. But it took OER 11 months to turn upward.
Now, Case-Shiller is decelerating again. That trend started in May 2022.
But once again, OER is lagging Case-Shiller. We just entered the 10th month after the most recent Case-Shiller peak.
And based on recent history, we can reasonably assume we’re very close to the OER peak.
Will it be exactly one month from now?
No, probably not.
But we do know that we’re nearing the of the inflation war. When OER starts to decelerate in a meaningful way – and we know that will come soon – the soaring prices of goods and services will slow down.
So folks, our takeaway is simple…
The inflation battlefield looks chaotic. But the Fed is winning its inflation war.
We could be nearing a peak in this critical inflation component right now. That means we’re likely closer to the end of this cycle of rising interest rates than many folks realize.
Good investing,
Marc Gerstein