Folks, we’ve endured a wild month…
Stocks started March with a pullback from their early February high. And before long, the banking crisis made everything worse. The S&P 500 Index fell nearly 5% in a single week.
So I get why many people might still be feeling startled.
But over time, the market gives us strong historical data. As investors, we can’t deny that data.
Regular readers know I recently explained an indicator with 100% accuracy. (If you haven’t already, you can read about that indicator right here.)
And today, I’m once again seeing a nearly indisputable signal in the market…
Going all the way back to 1950, this signal has only led to losses for the S&P 500 over the next year on two occasions. And each of those times, the return was barely negative.
Through 37 samples dating back 73 years, this indicator has a 95% positive rate.
Even better, as I’ll show you today, this indicator gives us an idea what to expect from the S&P 500 for the rest of this year. And as investors, you’re not going to believe it…
I won’t draw things out any longer…
The indicator we’re looking at today reveals that the market is capable of hitting an 18% total return this year. Seriously. And as I said, this indicator is correct 95% of the time.
You see, this indicator is related to the S&P 500’s lowest point in December.
That low was 3,783.22 on December 28. You can see it on the following chart…
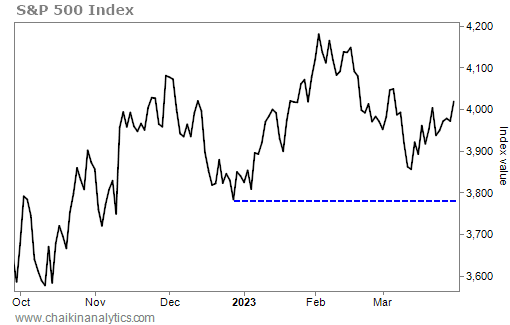
Now, as you can also see in the chart, we’ve nearly completed the first quarter of 2023. And despite all its twists and turns, the S&P 500 stayed above that December low.
That’s an incredibly powerful signal throughout history…
According to Carson Investment Research, this signal has happened 37 times since 1950. In every case except two, the S&P 500 produced a positive return over the next year.
The two exceptions were in 2011 and 2015. But the worst result was a 0.7% drop.
This is where the data gets really interesting…
The average one-year return after this signal is 18.6%. And the median return is 18.1%.
In other words… one or two big winners aren’t skewing the results.
Now, I understand that this might feel like a contrarian statement right now. It seems like many folks are still busy preparing for the next collapse. But the data is clear…
The market is recovering. The S&P 500 is up nearly 5% so far this year.
And as I detailed recently, the Power Gauge just turned “bullish” on the benchmark index.
Now, this huge historical signal is behind us…
The market is completing the first quarter of the year above its December low.
History tells us that means big gains are possible through the rest of the year. And even if that doesn’t happen, the downside should be relatively mild.
That means our job is to find the best opportunities. I recommend you do the same.
Good investing,
Marc Chaikin
P.S. Sometimes, finding the best opportunities can be tough. But if you know where to look, it gets much easier…
That’s why I hosted an emergency broadcast earlier this week.
I showed attendees the one thing they need to do this year to be on the right side of history. And everyone who tuned in got a FREE recommendation. Watch the replay here.