Folks, as we all well know, it’s an election year. And we typically see a lot of volatility – or “noise” – during years like this one…
But it’s not necessarily bad volatility.
In fact, history shows us that it’s usually good news for investors…
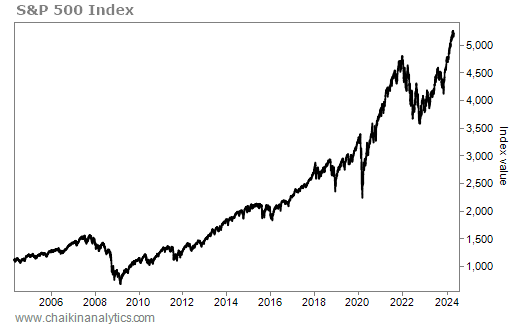
For starters, we need to remember that stocks go up more than they go down over the long run. That’s clear if we look at any long-term chart of the S&P 500 Index…
Taking it a step further, the good times typically last longer than the bad times…
Fidelity Investments studied stock market data all the way back to 1872. According to the financial-management firm, we’ve had 26 bull markets and 26 bear markets over that span.
The bear markets lasted an average of about 19 months. Meanwhile, the bull markets went on for an average of roughly 42 months.
So based on 152 years of data, we know that bull markets typically go on for more than twice as long as bear markets. With that in mind, let’s zoom in on election years…
According to financial-services company Carson, stocks have typically risen 7.3% during election years since 1950. And they’ve gone higher an incredible 83.3% of the time.
But I have a twist on this data. And it’s even more “bullish” for folks like us.
See if you can spot what I mean in the following chart from Carson…
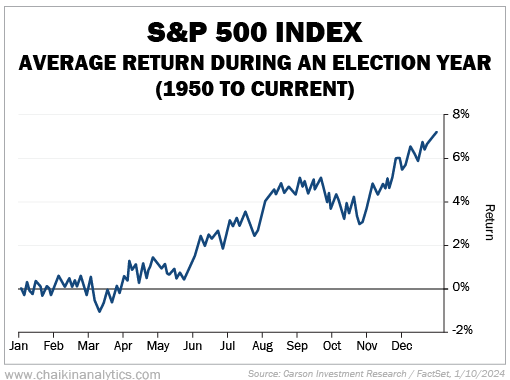
In short, election years are usually weaker at the start. Then, they rally later in the year.
This trend goes back to 1950. So we’re talking about almost 75 years’ worth of data.
But that’s not the case through the first three and a half months of 2024…
Stocks have already surged higher.
The S&P 500 is already up about 9% this year. That’s about 18 times better than the average election year’s roughly 0.5% gain at this point.
Now, you’ll also notice in the above chart that stocks tend to pull back in mid-March. Again, I’m just talking about the average results since 1950.
With that said, it’s not surprising that we’ve seen a bit of a slowdown in recent weeks…
The S&P 500 has already exceeded the full-year average of 7.3%. So the bull-case scenario for this presidential-election year is even better than history suggests.
That doesn’t mean stocks will go straight up. Pullbacks happen. In fact, we just saw the S&P 500 dip about 1% on Wednesday in response to slightly hotter-than-expected consumer inflation data.
And yet, we could still see a huge move higher before the summer ends.
I picked the summer for good reason. Again, it relates to the noise in an election year…
Remember, both political parties hold their national conventions over the summer. This year, the Republicans will gather in July. And the Democrats’ event will follow in August.
So I expect a lot of movement in the markets this summer.
In the best-case scenario, we could see what I call a “slingshot” move…
If you’ve ever used a slingshot, you know that you need to pull it back and slightly downward to make it work properly. If you do, your object will fly a lot higher and farther.
That’s what I believe could happen with stocks…
Any pullback likely won’t last long. And like a slingshot, we could then experience a rapid move higher.
The pullback before the slingshot could be our best “buy the dip” opportunity in 2024. And for the record, as inflation stays persistent, the very best place to invest money is in the stock market. How else can you keep up with high prices for goods and services?
Now, I want to be clear…
The markets have already overshot the average return in a presidential-election year to the upside. So it wouldn’t surprise me if the pullback were a little worse than the average, too.
But don’t panic. As I’ve explained, stocks have room to run higher this year.
Good investing,
Pete Carmasino