Every day, a massive brawl breaks out…
This brawl can be brutal – and sometimes unreasonable. It starts on the other side of the world, long before most of us wake up. And it ends here at home about a half-day later.
But the thing is… nobody throws any punches during this brawl.
Rather, this punchless brawl plays out between buyers and sellers in the stock market. And of course, if you know how to fight this brawl the right way, you can make a lot of profits.
You see, to most folks, the world’s stock markets are just numbers to look at in the daily news. But to technical operators like me, they’re full of stories worth watching every day.
If you want to fight this brawl as well, don’t worry about the “why.” You’ll eventually find that out. At first, just take in everything you see – especially if it happens over and over.
That leads to the “what” and “when” of a trade. These pieces are critical for winning the punchless brawl. And as you’ll see today, an iconic retailer just gave us a great example…
“Technical analysis” is a method of evaluating securities. And importantly, it differs from “fundamental analysis”…
Technical analysis focuses mostly on price and volume. Those factors can create patterns for traders to identify.
Fundamental analysis looks more at the inner workings of the company. This type of stock analysis involves factors like debt levels, earnings, and cash flow.
The best way to remember the difference is that fundamentals look inside the company. And the technicals provide traders with a look at the outside – or the price action of the stock.
Using technical analysis, traders could’ve just realized a gain of nearly 40% in less than a month. And more notably, they could’ve done it without even knowing the “why.”
Specifically, I’m talking about Macy’s (M).
The iconic retailer’s stock recently went through what I call a “tactical turning point”…
You see, the Power Gauge turned “bullish” on Macy’s on November 16. And just two trading days later (November 20), the stock’s tactical turning point became obvious. Take a look…
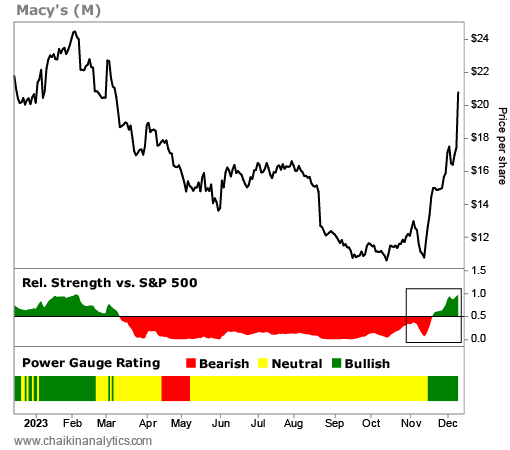
The two bottom panels below the main price chart show the stock’s relative strength versus the S&P 500 Index and its Power Gauge rating.
I also drew a square around the tactical turning point in the relative strength panel.
In short, as you can see, our proprietary relative strength indicator flipped to green on November 20. That told us Macy’s had started to outperform the broad market.
At the time, the stock traded for about $15 per share.
Now, I get it…
Buying Macy’s shares in mid-November might not seem like a big leap of faith. After all, most retail-related stocks generate a lot of interest during the holiday season.
But as you can see in the chart, Macy’s stock suffered a steep drop throughout this year. And in mid-November, no one could figure out “why” it suddenly reversed and turned higher.
That all changed over the weekend…
You might’ve seen the headlines by now. Macy’s received an almost $6 billion offer from Arkhouse Management and Brigade Capital Management to take over the whole company.
The offer works out to about $21 per share. And after the news broke, the stock surged to $20.77 per share at Monday’s close. That’s nearly 40% above its price on November 20.
I hope you see my point…
Many times, technical analysis is key to winning the punchless brawl of the stock market. It helps us know the “what” and “when” about a trade. Then, the “why” comes out later.
And with the Power Gauge, it’s easy to see everything play out.
Good investing,
Pete Carmasino