By Marc Chaikin, founder, Chaikin Analytics
If you’re like most investors, you pay close attention to stocks and the economy.
So I don’t need to tell you that it seems like things are improving lately…
Jerome Powell hinted that the Federal Reserve could start slowing its interest-rate hikes as soon as next week’s meeting. And U.S. shoppers just produced record-setting spending over Black Friday weekend.
As a result, many folks believe the worst part of the storm is now behind us.
It’s easy to feel that way – especially after such a brutal year. Any bit of positive news gives discouraged investors a glimmer of hope that we’re finally turning a corner.
Folks, I don’t mean to keep harping on the negatives. But I want you to be prepared…
The bond market is singing a different tune right now.
You see, bond investors are some of the most sophisticated investors out there.
They have money – a lot of it. And they tend to be great predictors of market trends. So when bond market indicators start flashing warning signs, we need to pay close attention.
That’s happening right now…
The bond market indicator I’m talking about is the “yield curve.”
Don’t worry if you aren’t familiar with the yield curve. It’s easy to understand…
In short, this indicator helps us track the yields of U.S. Treasurys. These government bonds are among the safest investment vehicles in the financial markets.
Many analysts pay the most attention to the difference between the 10-year and two-year U.S. Treasury notes. This difference is often called a “spread.”
In most cases, the longer-term notes yield more (or have a higher “interest rate”) than the shorter-term notes. This is a “normal” yield curve. And it signifies a healthy market.
On the flip side, an “inverted” yield curve means short-term yields exceed long-term yields. It’s rare. But when this happens… watch out.
When the yield curve inverts, it means investors can count on a recession. A yield-curve inversion has preceded every recession for the past 50-plus years.
And even though stocks are rallying right now, the bond market isn’t nearly as optimistic. The yield curve is currently inverted at a historic level. Take a look…
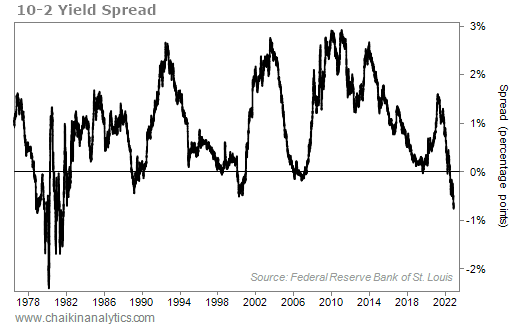
Notice that the “10-2” yield spread is normally well above zero. Again, that means the 10-year U.S. Treasury note usually yields much more than the two-year U.S. Treasury note.
But today, that’s far from the case. In fact, it’s the most inverted yield curve in 40 years.
The two-year U.S. Treasury note yields roughly 75 basis points more than the 10-year U.S. Treasury note today. The spread only got this extreme one other time in history – during the inflationary cycle leading into the early 1980s.
Let’s sum everything up…
The “smart money” is moving out of cash and into long-term debt. These folks are betting on a recession.
As a result, short-term debt – the two-year U.S. Treasury note – is viewed as a liability right now. And in turn, it yields far more than the longer-duration 10-year U.S. Treasury note.
Nobody likes it when the smart money bets on a recession. But these folks earned that nickname for a reason. So we should listen to them and tread lightly for now.
With that said, there’s a silver lining…
Even in the worst bear markets, some businesses still perform well. So until things get clearer, we’ll keep using the Power Gauge to help us find the best potential opportunities.
Good investing,
Marc Chaikin