July has been a wild ride…
Stocks started off strong – with the S&P 500 Index hitting a fresh all-time high on July 16. Since then, it has dropped roughly 4% in less than two weeks.
The decline is even more striking in the tech-heavy Nasdaq 100 Index. It’s down about 8% from its peak on July 10.
And some of the biggest names on Wall Street have taken a beating…
Nvidia (NVDA) is about 17% off its high last month. Amazon (AMZN) is down roughly 9% from its high earlier this month. And shares of Qualcomm (QCOM) have fallen about 21% from their June high.
But amid the volatility, you might have overlooked a major shift in progress…
For the first time in months, small-cap stocks are beating their larger counterparts.
As I mentioned earlier, the market peaked on July 16. So we can break the recent July period into two halves by tracking performance before and after the peak.
In the Power Gauge, we use exchange-traded funds (“ETFs”) to track different parts of the market…
The SPDR S&P 500 Fund (SPY) measures the S&P 500. The Invesco QQQ Trust (QQQ) tracks the Nasdaq 100. Meanwhile, the iShares Russell 2000 Fund (IWM) measures the small-cap Russell 2000 Index.
And during both recent periods in July, IWM outperformed SPY and QQQ. Take a look…
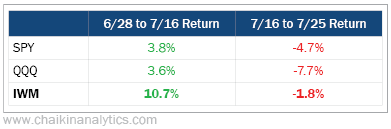
Small-cap stocks delivered more than double the gains of the other indexes during the early July rally. They also held up better as the market pulled back over the past couple weeks.
Traders have a word for this idea. It’s called “relative strength.”
In short, small-caps stocks are showing positive relative strength right now. And that’s a huge change from what we’ve seen over the past year-plus.
As you surely know, mega-cap stocks like the so-called “Magnificent Seven” have outperformed everything else lately.
Meanwhile, investors have completely ignored small caps.
IWM was up just 1% during the first half of 2024. That’s a pathetic performance compared with SPY’s nearly 15% gain and QQQ’s 17% gain.
In other words, IWM exhibited poor relative strength versus the other two indexes.
And as you can see in the chart below, small-cap stocks have been underperforming the rest of the market for many months. Here’s IWM’s one-year chart with some data from the Power Gauge…

You’ll find the relative strength reading in the first panel below the chart.
As you can see, IWM’s relative strength has been poor for nearly the entire past 12 months. Aside from a few weeks around the end of last year and start of this year, its relative strength versus the S&P 500 has been negative dating back to early 2023.
That’s a long stretch of underperformance. It’s a clear sign that investors gave up on small-cap stocks over the past year.
But notice the circle at the end of that relative strength panel…
IWM’s relative strength just turned positive for the first time since late last year.
In short, the Power Gauge is confirming what we saw from the performance numbers in the table above.
And earlier this month, our system turned “very bullish” on IWM. Take a look at this screenshot from the Power Gauge…
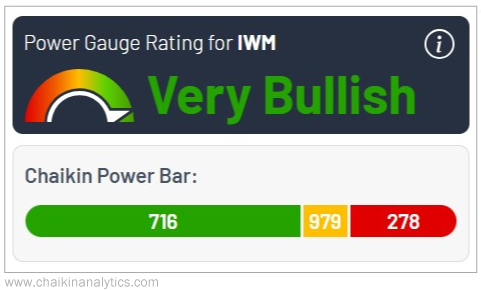
That’s a strong rating. And as you can see, the Power Gauge rates far more of IWM’s holdings as “bullish” than “bearish.”
Keep in mind, the recent stretch of underperformance by small caps is unusual…
Most people don’t know that smaller stocks historically outperform the rest of the market over the long term.
Over the 35-year period from February 1989 to February 2024, small-cap stocks returned 2,062%. Meanwhile, large caps returned 1,664%.
That’s why the recent relative-strength signal is so exciting…
It’s a sign the “bigger is better” trend is finally ending.
After more than year of underperformance, small caps are spring-loaded. And they’re likely to outperform the rest of the market over the coming months – or possibly years.
Good investing,
Marc Chaikin