We’ve often described the Power Gauge as a “one of a kind” system…
That might strike some readers as typical self-promotion.
But it’s much more than that…
You see, the Wall Street Journal recently found that most factor-focused investing models don’t beat the broad market over the long term. As the publication noted last Thursday…
The Journal concluded that evidence over the past 10 years is “pretty bleak” for factor exchange-traded funds (“ETFs”). And it suggested that ETFs tracking the S&P 500 Index “seem a better bet than exotic factor ETF offerings.”
Now, the Power Gauge is a factor model. And I’m one of the folks behind the system. So you might expect me to be upset about the Journal‘s findings.
But that’s not the case…
The factor ETFs in the Journal‘s research are great examples of how not to build a factor-focused investing model. They’re all based on academic and statistical best practices.
That’s the problem. We can’t expect them to succeed with real money.
The Power Gauge is different. Chaikin Analytics founder Marc Chaikin built our system based on the best real-world investing sensibilities. And as we love to say, it’s one of a kind…
Factors are characteristics that we assume can predict future stock prices. To qualify, the characteristics must be objective. And they must be observable here and now.
In short, we want to try to forecast the future with what we can measure and see in the present.
In the early 1990s, American economists Eugene Fama and Kenneth French developed a three-factor model for predicting stock returns. Specifically, they focused on…
- The overall market’s performance,
- Value (measured by price to book value), and
- Issue size (measured by market cap).
Fama and French (and the researchers who followed them) essentially looked at vast amounts of historical data. They hunted for common characteristics between stocks with similar performance.
They also constantly battled against charges of “data mining” or “curve fitting.” Those two terms refer to the naive matching between factors and stock performance.
As the Journal discovered, the failure of most factor methods to account for future growth led to poor results. Here’s its scorecard for specific factor ETFs over the past 10 years…
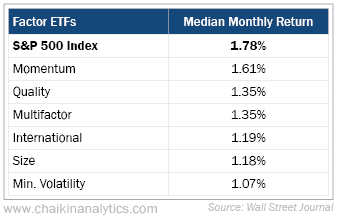
Every one of these factor ETFs failed to beat the S&P 500. Even worse for investors, the Journal found that several of the factor ETFs were more volatile than the index itself.
In other words, as a factor model, the Power Gauge is really one of a kind…
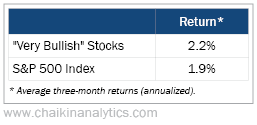
Over the past 10 years, stocks with “very bullish” rankings outperformed the S&P 500. You can see what I mean in the following table of average three-month returns (annualized)…
The Power Gauge is a holistic model. All 20 individual factors work together to produce a single, actionable rating. That’s why we focus on how they all interact in our research.
For example, just like human investors, our model can accept that higher valuation ratios will accompany strong growth prospects.
Academic factors that stress mathematical purity don’t do that. Lacking the data that sees the future, they ignore it.
That’s wrong. Growth is critical. It’s why a lot of people buy stocks instead of less-risky bonds.
Of course, we’re not psychics. We don’t know what will happen in the future.
But we work intensely with all sorts of proxies based on technical and expert data. And in the end, the Power Gauge is a proxy for the investment community’s future expectations.
Other models prefer fancy math. But Marc Chaikin rejected that idea. Instead, he used his five-plus decades of market experience to build the system we love and use today.
And as the data shows, the Power Gauge truly is one of a kind.
Good investing,
Marc Gerstein