As you likely know, it has been a brutal two years for U.S. housing…
But the current downturn isn’t surprising. It’s a result of the boom that started in 2020.
When the Federal Reserve slashed interest rates to near zero, it triggered a temporary housing boom.
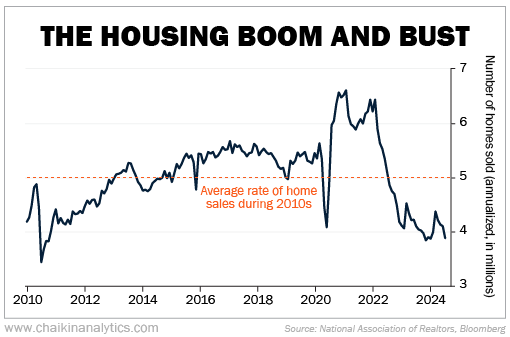
By late 2020, homes sales soared to more than 6.5 million (annualized). That’s the highest level since early 2006.
Let me put the recent boom in perspective…
Americans sold an average of 5 million homes each year during the 2010s. That means the housing market was running at more than 30% above normal levels going into 2021.
As we all know, every boom eventually fades…
So it’s no surprise that homebuying plunged when interest rates started to rise in 2022. Annualized sales fell back below normal levels in July of that year.
In the chart below, you can see the boom-and-bust cycle of the past few years. The dashed line shows the normal level of homebuying (the average annual rate of home sales during the 2010s). Take a look…
As you can see, the U.S. housing market has been running below normal for two years now.
Interest rates are the biggest reason for low sales. If folks with low rates move, they would be giving up their existing rate for a higher one.
Even worse, they would likely end up with a higher monthly mortgage bill – potentially on a smaller home.
Put simply, high mortgage rates have created “golden handcuffs” for millions of prospective homebuyers.
Homebuying activity is down a lot. But demand is surprisingly strong…
The latest housing-market data shows that the median U.S. home price hit $426,900. That’s a new all-time high. And it’s up 4.1% versus a year ago.
In short, the housing market might be in bad shape in terms of activity levels. But there’s still plenty of pent-up demand to support prices.
The other key factor is supply. New-home construction in the U.S. plunged after the housing bust more than a decade ago. And it stayed at extreme lows for the better part of a decade.
Earlier this year, Realtor.com released a study on U.S. housing supply. It estimated that our country faces a shortage of about 7.2 million homes.
In other words, the supply-demand situation will support prices for years to come.
The most likely scenario is a slow, steady thaw in the housing market over the next few years. In fact, we’re already seeing the early signs of this transition…
For one, more folks are putting their homes up for sale.
As of the end of June, more than 1.3 million homes were listed for sale in the U.S. That’s up more than 23% versus a year ago.
It’s also a little more than four months of supply (based on the current rate of sales). That’s the highest inventory level since May 2020.
Another positive sign is prices. They’re finally starting to decline in a few areas. Specifically, recent data showed that home prices fell in two cities in Texas (Austin and San Antonio) and two Florida markets (North Port and Cape Coral).
Yes, mortgage rates are certainly still higher than they were a few years ago. But they’re down from the recent peak late last year. And they’ve been going lower in recent months.
All of this means that the housing market is getting moving again. And so are real estate stocks…
In the past month, the Real Estate Select Sector SPDR Fund (XLRE) has jumped roughly 5%. Over the same time frame, the S&P 500 Index is down about 3%.
Meanwhile, XLRE currently holds a “bullish” rating in the Power Gauge. That means our system sees more upside ahead for real estate stocks.
If you’re not paying attention to this space right now… I recommend you look into it.
Good investing,
Marc Chaikin