Folks, the Power Gauge is telling us to rethink the energy sector…
When we mention the word “energy,” most investors typically think about oil and gas prices. From there, their focus moves on to oil and gas producers.
But the producers don’t act alone. They need a lot of help from other types of companies – like oilfield equipment and services businesses.
Meanwhile, all oil and gas companies benefit from higher production. But the nature of those benefits can differ…
When production increases or decreases, it’s easy to track how that helps or hurts producers’ revenue. It’s not so clear with the oilfield equipment and services companies.
So between the two types of companies, oil and gas producers usually lead the way. And the oilfield equipment and services companies are just along for the ride.
But as I’ll explain today, the energy sector has been veering off script over the past six months. And you’ll see that the Power Gauge is now validating this unusual trend…
The following chart shows the typical relationship between the SPDR S&P Oil & Gas Exploration & Production Fund (XOP) and the SPDR S&P Oil & Gas Equipment & Services Fund (XES). It starts when these two exchange-traded funds’ (“ETFs”) debuted in 2006…
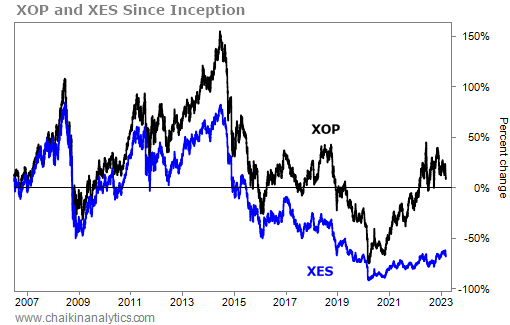
You can clearly see that XOP leads the way most of the time. It regularly trades above XES. And it usually moves up or down before XES. Meanwhile, XES just follows along.
That makes sense…
As I said earlier, oilfield equipment and services companies’ revenue boosts aren’t as clear when oil and gas prices rise. So their stocks typically lag behind the producers’ stocks.
But the chart looks very different over the past six months. As you can see, XES is now in front…

These two ETFs also differ a lot in terms of their Power Bar ratios…
Remember, our Power Bar ratio compares the number of favorably and unfavorably ranked holdings within an ETF. Here’s the current breakdown for XOP and XES…

That’s a dramatic difference…
The production-focused ETF doesn’t contain any “bullish” or better stocks right now. On the flip side, the equipment-and-services ETF has eight “bullish” or better opportunities.
Put simply, oil and gas producers are hurting. But the companies that service them are significantly stronger.
Oil and gas prices have corrected. And production has been soft.
In an attempt to protect prices, many producers cut back on drilling. Instead, they’re using any surplus cash to pay down debt, buy back stock, and boost their dividends.
But oilfield services and equipment companies are still strong. That trend produced this extreme result. The stocks of these companies are soaring past producers’ stocks.
Keep in mind that oil and gas is an extremely complex business…
So we’re not simply talking about a play on prices. Political factors and technological changes loom large. And of course, some businesses are dabbling with “green energy.”
My point is…
With so many variables in play, I’ll trust the Power Gauge to guide me. Our proprietary system is designed to do all the hard work for everyday investors like us.
The Power Gauge prefers oilfield equipment and services companies over oil and gas producers right now. And as we’ve seen today, the recent trend backs up that idea.
I recommend watching this trend closely in the weeks and months ahead.
Good investing,
Marc Gerstein