Editor’s note: Last year was tough for most investors…
But regular readers know that I (Marc Chaikin) believe data helps us light the right path. And of course, I believe in the Power Gauge as well. It’s our guiding light as investors.
So I recently asked our senior quantitative analyst Karina Kovalcik to complete an important task. I wanted her to crunch the 2022 numbers using the Power Gauge’s ratings system.
The results might surprise some of you… but not us.
In short, the data supports what we’ve believed all along. It doesn’t matter whether the market is going up, down, or sideways. All investors need the Power Gauge at their side…
Many investors took a big hit in 2022…
The benchmark S&P 500 Index fell almost 20%. The tech-heavy Nasdaq Composite Index plunged around 30%. And of course, many individual stocks suffered even worse.
If you’re like a lot of folks, I bet it was painful to watch your wealth wash away.
You might even feel like you couldn’t do anything about it. Maybe you’re reading this essay and thinking, “Everything was getting wrecked. I just had to ride it out and take my lumps.”
That couldn’t be further from the truth.
Sure, almost everything fell last year. And you’ll see today that even the best-ranked stocks in the Power Gauge suffered losses. But in volatile years, the system still gives us an edge…
In short, minimizing the damage is the key to getting ahead in turbulent times.
If you can do that, you’ll set yourself up for success over the long term. You’ll be in a better position to thrive as the next bull market unfolds. And the Power Gauge lights that path…
Regular Chaikin PowerFeed readers know all about the Power Gauge…
Chaikin Analytics founder Marc Chaikin created this one-of-a-kind system for everyday investors about a decade ago. He used his decades on Wall Street to fine-tune everything.
You see, almost all Wall Street analysts look at “factors” to guide their investment choices…
A factor is a data point that tells you something about a company. It could be about the company’s growth potential, earnings, cash flow, valuation, or much more.
Every individual factor tells you one specific thing about a company. When they’re combined, they’re even more powerful. They tell you the real story about a company.
This story can give you a good idea about the company’s future path.
First, Marc researched and confirmed the 20 most important factors. Then, he combined them into an easy-to-understand ratings system for people like you and me – the Power Gauge.
It’s a lot like a traffic light…
Red (“bearish” or worse) stands for stocks that you should avoid. Something about their factor story doesn’t add up. And it’s best to not get involved. You’ll find many better stories in the markets.
Yellow (“neutral”) stocks come with a murkier story. For one reason or another, you can’t get a clear read. Their path could go one way… but it’s just as likely to go the other way.
Green (“bullish” or better) is where the good stories hang out. These stocks are positioned to do well. If you stick to these stocks, you’re more likely to succeed over the long term.
Now, as we all know, 2022 wasn’t good for most stocks. And the Power Gauge data supports that narrative. Stocks across every ratings category suffered losses last year.
But importantly, sticking to the higher-ranked stocks minimized the damage.
Take a look…
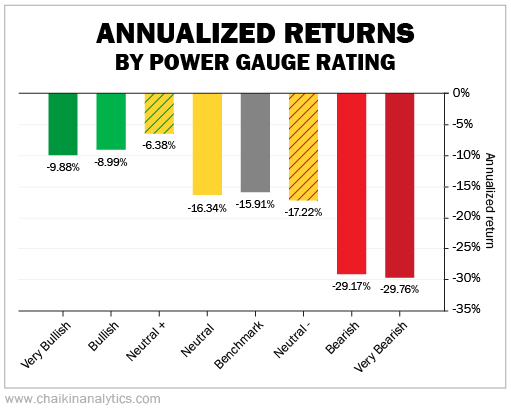
The chart breaks down all the stocks with Power Gauge ratings into categories. And it shows how your portfolio would’ve fared if you bought every single stock within a specific category.
The benchmark is a hypothetical portfolio of all the stocks in the Russell 3000 Index held in equal weights. It had an annualized loss of around 16% last year (based on rolling returns with a one-quarter holding period).
Now, we know it isn’t realistic to expect you to buy all the stocks. After all, the Power Gauge rates more than 5,000 stocks and exchange-traded funds.
But the takeaway from this chart is clear…
If you avoided the red stocks (“bearish” or worse) and stuck with the green stocks (“bullish” or better), you would’ve outperformed the benchmark. The data proved that last year.
In other words, following the Power Gauge ratings would’ve given you an edge.
I’m sure those of you who already use the Power Gauge knew that. You probably experienced that in your own portfolio last year.
But if you’re not already using the Power Gauge, consider letting it light your path forward.
Good investing,
Karina Kovalcik