Anybody who thought the metaverse would be paradise just got a rude awakening…
On February 3, metaverse pioneer Meta Platforms (FB) plunged 26%. It was the social media company’s biggest one-day drop ever – topping a 19% decline in July 2018.
In addition to a bad earnings report, Meta projected weaker-than-expected revenue growth in the next quarter. And its Facebook platform suffered its first-ever membership decline.
Fortunately, I didn’t suffer from Meta’s collapse. But I’ve experienced other implosions… And I bet you have, too.
After more than 30 years in finance, I’ve learned that there are two kinds of investors – those who’ve endured and learned from Meta-like pain, and those who haven’t.
So today, let’s get ahead of the metaverse’s next collapse. To do that, we must consider what you can do to minimize your exposure to this sort of trouble in the future…
Let’s start with Meta’s price chart, as well as some of the most important components at the heart of our Power Gauge system. Take a look…
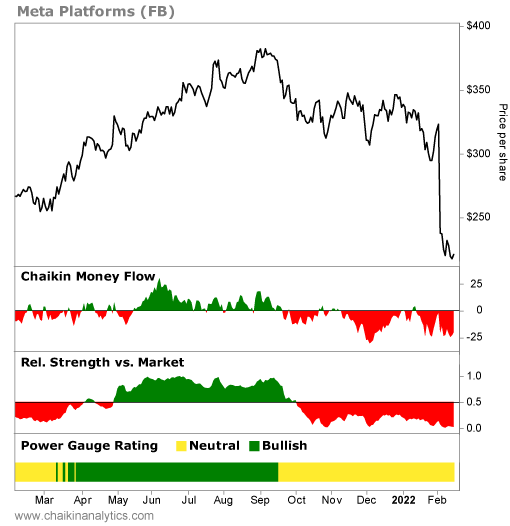
We’ll go from the bottom to the top for this breakdown. The visual setup is simple… For the Power Gauge’s components in the lower panels of the chart, green is good, red is bad, and yellow is in the middle.
The panel at the bottom shows our Power Gauge’s overall ranking over the past year. It’s “neutral” now… But notice the change from green (“bullish”) to yellow in September. We’ll come back to that.
Next up is Meta’s relative strength compared with the SPDR S&P 500 Trust (SPY) – the exchange-traded fund that tracks the benchmark index. Notice that this panel is deep into the green or red sections, depending on whether the stock is beating or trailing SPY.
This is extremely important… Wall Street always has a reason for doing what it does. That’s true whether we approve or not – or whether we can figure out the reason at all.
Now, notice that this band has been red since late September – and in a big way, too. It’s a more convincing stretch than the tiny, tentative bit of red last spring (near the left edge).
Relative strength going abruptly from deep in the green to deep in the red at roughly the same time that the Power Gauge changed from consistent green to consistent yellow means something.
At Chaikin Analytics, we call this type of setup a “personality change” for the stock. And in this instance, it was a change for the worse.
The next panel up is the Chaikin Money Flow. This indicator introduced the Chaikin brand to Wall Street years ago. And these days, it’s seen on Bloomberg Terminals everywhere.
As you know, every trade has a buyer and seller. The Chaikin Money Flow tells us which side of the trade the “smart money” is taking. They’re the big guys in the investing world, so we always want to know what these institutional investors are up to.
This indicator also shows us how motivated the smart money is to say, “OK, enough price haggling, I just want to get this trade done now.” We can see that when the line is deep in the green or red section. It’s proof that the smart money is buying or selling in a big way.
Expect the Chaikin Money Flow to regularly alternate between green and red. That’s because the smart money is always adjusting its portfolios. (Sometimes, these folks still love a stock, but they sell some shares to diversify and make room for other great ideas.)
In Meta’s case, you can see that the Chaikin Money Flow changed around the time that the stock underwent its personality change. It didn’t just turn red… It went red with attitude.
Finally, don’t forget to look directly at the stock’s price action. It’s headed lower.
No matter how you calculate the long-term trend, the answer is clear… Mr. Market has been shouting, “I hate FB shares!” since last fall.
Look, chart analysis isn’t voodoo… It’s about following signals – like a fire alarm.
A fire alarm doesn’t always mean the building is on fire. But you don’t stick around to find out… You run to safety first. And you look for the reason the alarm went off later.
Folks who ran at the Power Gauge’s first warning signal for Meta last fall and looked for the reason later found plenty… The company has been plagued by whistleblower allegations, ongoing controversy over data use, Congressional scrutiny, and more.
Don’t risk exposing yourself to flames when an alarm sounds. Run to safety, then take the time to investigate further. If you decide it’s a false alarm, you can always rebuy the stock.
If you learn to follow this approach, you’ll be much better off in the long term.
Good investing,
Marc Gerstein