It’s official, folks…
Federal Reserve Chair Jerome Powell is adjusting the central bank’s posture.
Powell told reporters yesterday that the Fed is still asking itself, “Should we hike more?” But then, he followed that question with a newly “dovish” statement…
Slowing down is giving us, I think, a better sense of how much more we need to do, if we need to do more.
The Fed is “slowing down.” In other words, it’s taking a breather to check its surroundings.
Now, many Wall Street analysts see this development as a win for investors. After all, the Fed’s rate hikes were designed to slow the economy. More specifically, the Fed hoped to slow inflation.
And it’s working…
The year-over-year change in the Consumer Price Index has fallen from more than 9% in June 2022 to 3.7% today. So based on that development, the Fed is executing its plan.
But that doesn’t mean we’re out of the woods yet…
Existing U.S. home sales are in freefall. And new home sales are still below the level they hit in 2019. When you throw in current mortgage rates, the housing market is locked up today.
Meanwhile, auto-loan defaults are at a level we haven’t seen since the 1990s. And while credit-card defaults are still historically low, they’re soaring off their recent low.
In short, the Fed is taking its foot of the economic brake pedal. But from housing to cars to credit cards, the cracks are clear. And recession clouds are still looming over the horizon.
That leaves many folks wondering when the next recession will come.
So today, let’s discuss how I’ll set my “recession alarm clock”…
Unfortunately, my crystal ball is broken. But we can use a long-term historical chart to give us an idea about when the next recession could come…
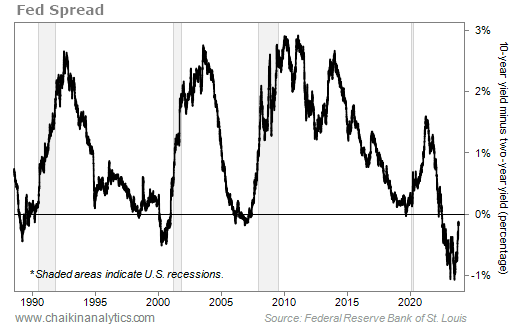
It’s the so-called “Fed spread” over the past three-plus decades.
We talked about this indicator in late September. In short, the Fed spread is the difference in the yields on the 10-year U.S. Treasury note and the two-year U.S. Treasury note.
An “inverted” Fed spread happens when the yield on the shorter-term Treasury soars above the longer-term Treasury’s yield. And it’s one of the best available recession predictors…
The gray bars on the following chart represent official recessions. You’ll notice that the Fed spread inverted shortly before every recession going back to the late 1980s. Take a look…
But today, I want to highlight another important point about this chart…
In every case, a recession didn’t officially start until after the Fed spread moved back above zero. In fact, history tells us that it can take several months for a recession to happen.
Now, there is one monkey wrench in this idea. In the 1980s, we endured multiple recessions and wild yield-curve fluctuations.
But today, the chart looks a lot like the past few decades…
Folks, as you can see, the Fed spread is still below zero today. Based on what has happened since the late 1980s, that likely means we’re still at least months away from a recession.
So when will I set my recession alarm clock?
I’ll set it for “once the Fed spread moves above zero again.”
And even then, I’ll know that doesn’t necessarily mean we should sell everything right away. History tells us we’ll likely have months of opportunity left in the market at that point.
Good investing,
Vic Lederman