Our marketing folks are always so dramatic…
They want the biggest, juiciest numbers. They want claims of massive upside potential. And they want everything to happen in the blink of an eye.
That’s the type of stuff that attracts the most attention. So it makes life easy for marketers.
But as we all know, the stock market doesn’t always work like that…
I have the perfect example, too. One of our top marketing folks reached out to me and asked, “Vic, what keeps you up at night?”
After all, things seem bad in the market right now. The S&P 500 Index is down roughly 7% from its peak. And it might feel like it’s nearly impossible to stay focused on the long term.
But here’s the thing…
I got asked that question more than a year ago.
That’s not even the craziest part…
You see, the thing that kept me up at night back then is still true today.
Let’s look closer at why this idea continues to hold my attention. You’ll see why you should be watching it, too – and why it shouldn’t keep you from growing your portfolio yet…
Now, I first got asked about what keeps me up at night on August 24, 2022.
That was a little more than 13 months ago. And as I said, it’s still true today…
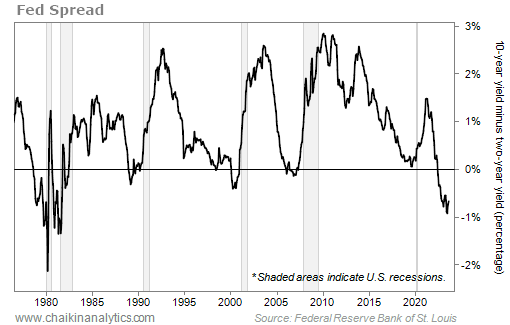
I’m talking about what some folks in the industry call the “Fed spread.” It’s the difference in the yields on the 10-year U.S. Treasury note and the two-year U.S. Treasury note.
That might sound esoteric. But it’s easy to understand once you know why we look at it…
U.S. Treasury bills, notes, and bonds are essentially “IOUs” from the government. They range from four weeks to 30 years. And importantly, they’re the standard for interest rates on all other loans.
To that point, 10-year loans should charge a higher rate than two-year loans. That’s because a 10-year period has more “time risk” in it than a two-year period.
But occasionally, the market gets out of whack. When that happens, short-term rates can rise above long-term rates.
It can occur for all kinds of reasons. But the Federal Reserve raising interest rates usually plays a big role. And of course, we’ve lived through that for more than a year now.
You can see on the chart that a so-called “rate inversion” almost always happens before a recession (the gray bars). It’s a nearly infallible sign of tough times ahead. Take a look…
You probably notice something else about the chart as well…
The Fed spread is currently the most “inverted” it has been since the early 1980s.
That keeps me up at night.
But as you can see on the chart, the recession always lags the rate inversion. And sometimes, it can be years before the storm arrives.
So today, we know that something is wrong with the markets. The Fed spread is inverted. And more than four decades of market history tells us that eventually leads to a recession.
But the storm clouds aren’t here yet…
In fact, the growth-focused Nasdaq Composite Index has soared more than 15% since June 2022. That’s when the Fed spread first inverted during the current cycle.
So in short, the opportunity hasn’t dried up. You can still make money if you know where to look today. That’s true even after a rough couple of months in the market.
I’ll keep using the Power Gauge to watch things closely. And I recommend you do the same.
Don’t get caught sitting on the sidelines waiting for a recession. You could be waiting a long time.
Good investing,
Vic Lederman