Stocks experienced a historic run over the past few months…
The S&P 500 Index closed at 4,117 on October 27. Last Friday, it closed above 5,000 for the first time. That meant the index surged more than 20% in less than four months.
That was roughly two years of “expected” returns from the broad market in about a quarter.
Not surprisingly, the index shifted into “overbought” territory with a move like that.
Stocks dipped earlier this week in the wake of a higher-than-expected inflation reading for January. And now, it’s looking like we could either be in the early stages of a sharper pullback… or that we’re just about to experience one.
Today, let’s look at how we can see that in the Power Gauge. We’ll also discuss what it means for investors in the short term.
The following chart shows the SPDR S&P 500 Fund (SPY) – the exchange-traded fund that we use in the Power Gauge to track the benchmark index.
In the panel below the price line, you can see the recent move into overbought territory – the highest level since November…
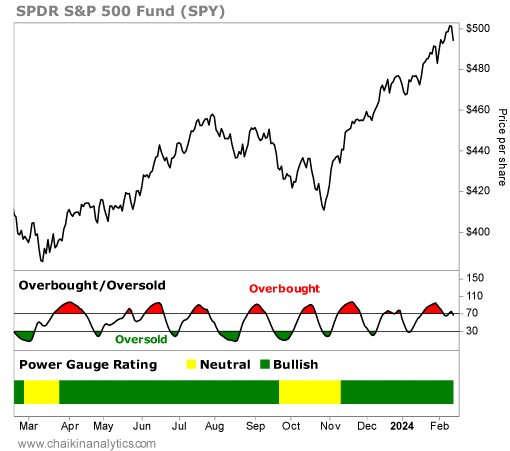
When the market becomes overbought, it doesn’t stay there forever. Notice in the chart above that it ebbs and flows between overbought and “oversold” – like waves in the ocean.
You’ll also realize that the market doesn’t necessarily sell off when it becomes overbought. But this time, due to many factors, I believe we’re on the edge of a short-term pullback…
Sure, the pullback might prove to be just a small blip in the long run. But it’s the kind of thing that can easily take complacent investors by surprise.
That’s the surface-level view. And I love that the Power Gauge makes it easy to spot an overbought setup. But we can go deeper. When we do, the evidence supports my view…
I don’t talk about the next signal often. But it makes the recent overbought setup even clearer.
It’s called the “bullish percent index” (“BPI”).
The BPI is an indicator of market “breadth” – the number of advancing or declining stocks in an index. It’s a way for investors like us to quickly spot strength or weakness in the index.
The BPI is based on a method in technical analysis called “point and figure” charting. If you’ve never seen a point-and-figure chart before, well, I admit… it looks a little unusual.
Here’s an example…
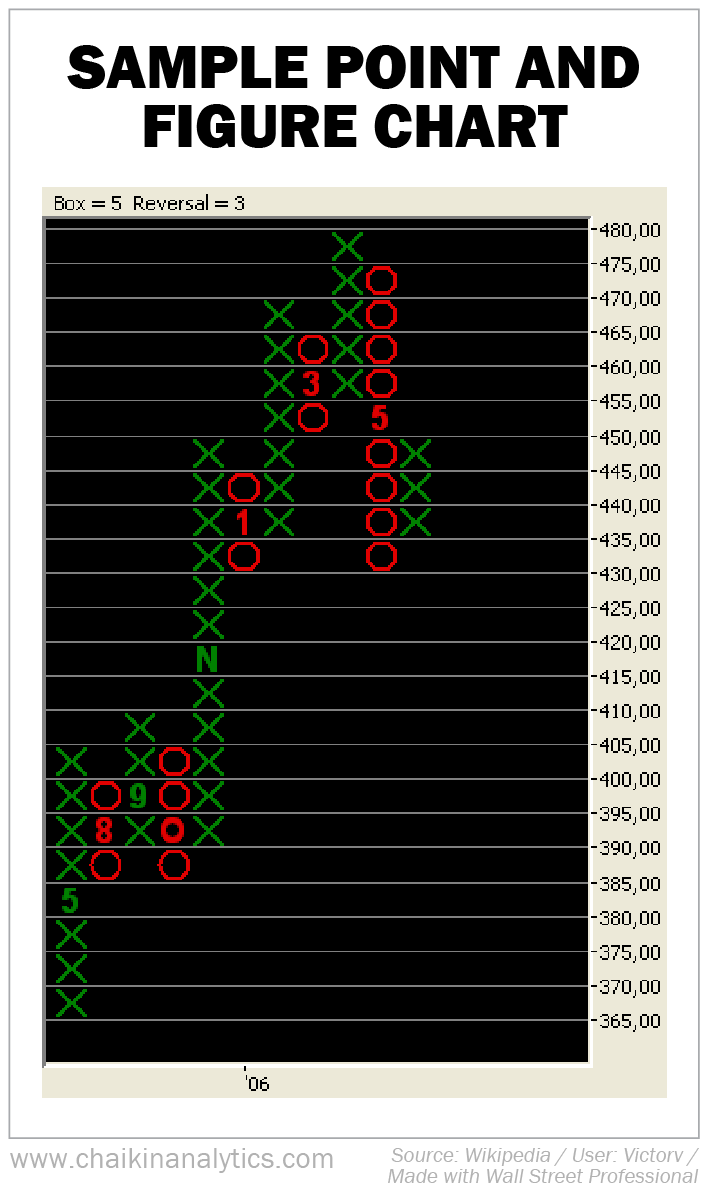
This chart probably looks like some sort of alien language to most of you. Fortunately, you don’t need to learn how to read and interpret these charts to benefit from them…
You see, the BPI scans the associated index to see whether a stock is in a “bullish” signal (based on the point-and-figure method). Then, it calculates in terms of percentages.
The basic explanation of BPI is simple to interpret…
When the indicator is above 70%, it tells us that an index is considered “overbought.” And when it’s below 30%, the index is considered “oversold.”
Now, let’s look at the BPI for the S&P 500…
I’ve put bold red (overbought) and green (oversold) lines at the 70% and 30% levels, respectively, on the index chart below. That way, you can easily see what’s happening.
As you can see, the BPI for the S&P 500 recently moved from a higher level to below 70%…
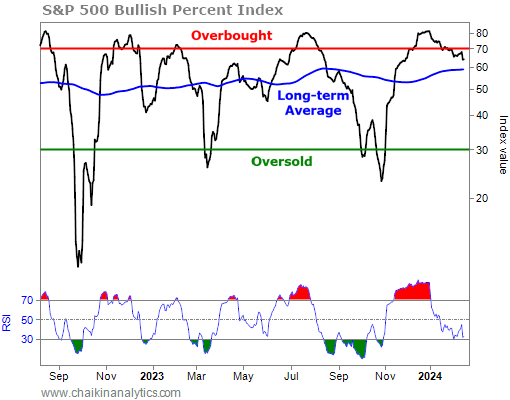
Now, this indicator is in a downward trend. It’s pulling back as the market is slowing down.
Next, look at the 14-day relative strength index (“RSI”) in the bottom panel. It’s in a short-term correction.
In this case, the short-term RSI is important because it’s an “indicator of an indicator.”
It can remain oversold (like what happened between August and November). And because of that, the BPI can continue to correct lower.
Keep in mind that this is all happening right in the middle of “earnings season”…
Earnings season is when the bulk of companies report their performance over the previous quarter. And it happens four times every year. So you wouldn’t think it would be too volatile.
But as you know, companies surprise us all the time. As a result, uncertainty rises.
You wouldn’t know it just by looking at a basic price chart of the S&P 500. But the market is richly valued compared with a few months ago. And when earnings season is in full force, things can get volatile.
So, it’s OK if the market pulls back a little more. And if it does, you won’t be surprised.
Good investing,
Pete Carmasino