Editor’s note: Regular readers know that Chaikin Analytics founder Marc Chaikin has long been expecting stocks to have a strong finish to the year…
But there’s more to it than that. He also believes the market’s rally will continue to broaden out. That means upside ahead for small- and mid-cap stocks – not just the market’s biggest.
Meanwhile, our friend Brett Eversole has also noticed evidence for a rally in smaller stocks…
As longtime readers know, Brett is an editor at our corporate affiliate Stansberry Research. And the essay we’re sharing from him today just published yesterday in his free DailyWealth e-letter. In it, Brett explains how a recent breakout in one index points to upside ahead for smaller stocks…
The biggest stocks lead to the biggest gains…
That has been the investment theme of the past two years. The idea of the “Magnificent Seven” came into existence last year for this exact reason.
But now, the tide is turning…
Specifically, we recently saw a breakout in an index that looks beyond the largest stocks. And despite the volatility that followed, that jump is important to what’s coming next.
As I’ll explain today, it suggests this unique market tracker could see double-digit gains over the next year…
The S&P 500 Index is the most popular way to track the U.S. stock market. But like most major indexes, the largest companies dictate how the index moves.
That’s because the index weights companies based on their size. The bigger a business, the more influence it has on the index. And right now, the three largest stocks make up about 20% of the S&P 500.
It doesn’t have to be this way. You can use the same stocks to build the index without weighting them by size. If you do that, you end up with the S&P 500 Equal Weight Index…
This index holds the same S&P 500 stocks, but at an equal weight. So instead of the three largest stocks making up 20% of the index, they make up less than 1%.
That said, buying the equal-weight index hasn’t been a good strategy in recent years.
Owning less of the biggest stocks would have meant missing many of the strongest performers of the past few years. But last month, this index staged a breakout. Take a look…
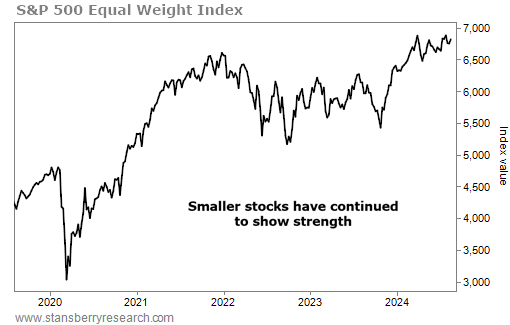
The equal-weight index recently broke out to a new all-time high. And at the end of July, it hit a new 52-week high. Even with the recent market pullback, that second breakout is worth paying attention to right now.
To see it, I looked at every similar setup since 1990. New 52-week highs have happened 25 other times since then. And the index tends to keep rising after rallies like these. Take a look…
The equal-weight index may not have kept up with the S&P 500 in recent years, but it has been a smart investment over history. It has gained 9% per year since 1990 – even better than the 8.2% annual gain we’ve seen in the regular S&P 500 over the same three decades.
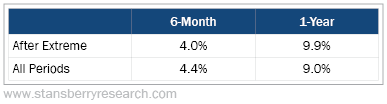
Still, you can do a bit better by buying after a breakout. Those setups led to 4% gains in six months and nearly 10% gains over a year.
That’s a slight underperformance in six months… and slight outperformance over a year. But these setups also led to gains 84% of the time a year later. So the odds of success are high.
More important, we shouldn’t panic over the recent pullback. And we shouldn’t view the new dominance from smaller stocks as a bad sign for the overall market. History shows the opposite…
The equal-weight index should keep moving higher. What’s more, the normal S&P 500 led to outperformance in the year following these setups as well.
So however you own stocks, the good times are likely to last.
Good investing,
Brett Eversole
Editor’s note: For regular insights like this from Brett and his team, consider signing up for his DailyWealth e-letter. It’s completely free and publishes on weekday mornings when the markets are open – just like the Chaikin PowerFeed.
To learn more about DailyWealth and sign up to receive it, click here.