It’s hard to escape the doom-and-gloom headlines…
We’re in the midst of a contentious election cycle. And the first presidential debate last week was a spectacle, to say the least.
In the Middle East, Israel is still at war with Hamas. And there’s still a chance that conflict will expand.
Meanwhile, Russia’s invasion of Ukraine is in its third year.
Then there’s China…
Its tensions with Taiwan aren’t new. But other problems are bubbling up…
The U.S. is moving forward with its plan to ban the social media app TikTok. And China has hinted at retaliatory action against U.S. companies in response.
Worse still, recent reports show that China’s factory industry is slowing. Global demand simply isn’t as great as China needs right now.
After pondering on all of that, you’re left to look at this market… and there’s no question it’s running hot.
The tech-heavy Nasdaq 100 Index is up about 18% so far this year. And the broad market S&P 500 Index is keeping pace with a roughly 15% gain.
So it’s no wonder that some folks think we’re nearing the end of this bull run. But there’s something they haven’t considered…
Now, I’m not going to try to pretend the market isn’t running hot right now.
But that doesn’t mean it can’t keep going up. And today, we’re going to look at a simple reason why…
Below, you’ll see a five-year chart of the Invesco QQQ Trust (QQQ). That’s the exchange-traded fund (“ETF”) we use to track the Nasdaq 100 in the Power Gauge.
I’ve drawn a gray dashed line across the chart. And it specifically pegs the peak in 2021.
Back then, QQQ peaked at about $404 per share. Today, it’s trading around $482 per share. Take a look…
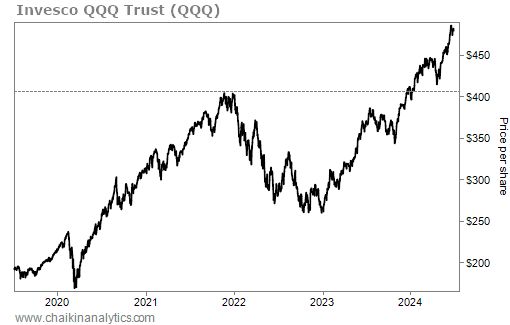
That might seem like a massive jump. But it’s about 19% since November 2021.
Since inception, QQQ’s annual return is nearly 10%. Folks, if anything, the gains aren’t as big as they could be by this measure…
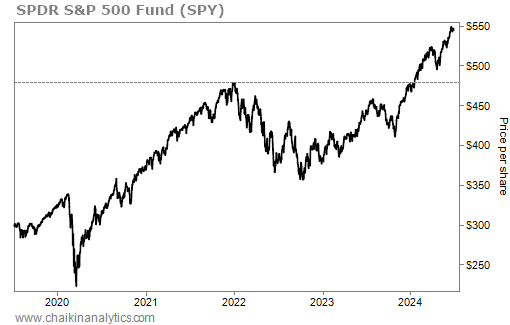
And we see the same thing looking at the S&P 500, too.
Once again, I’ve included a five-year chart below. And we’re using the SPDR S&P 500 Fund (SPY) as our stand-in for the S&P 500. That’s the fund we use in the Power Gauge to track the index.
You’ll notice on the chart that SPY’s last big peak was near the same time as the peak in QQQ. Right at the beginning of January 2022, it was trading for around $478 per share.
Today, SPY is trading at around $545 per share. That’s a roughly 14% gain in about two and a half years. Take a look…
Folks, this may seem simple. But that’s the reality of the situation we’re in…
Sure, the market is running hot. But when you look at the last peak… and how long it has been since then… it’s obvious that there could be more room to run.
Will we see pullbacks along the way? Of course we will. Pullbacks happen – even in a bull market. But that doesn’t mean it’s time to sit on the sidelines.
There are still plenty of opportunities out there. And I’m going to use the Power Gauge to help me find them.
Good investing,
Vic Lederman
P.S. Last week, my colleague and Chaikin Analytics founder Marc Chaikin just made the most important announcement of his 50-year career…
In fact, during a special event, he shared the No. 1 investing strategy he’s now recommending if you want to protect and grow your wealth in 2024. And as he says, virtually no one is doing it or even paying attention today.