Editor’s note: The markets and our Chaikin Analytics offices will be closed Monday, May 27, for Memorial Day. So we won’t publish our Chaikin PowerFeed e-letter.
We hope you enjoy the long weekend. And you can expect to receive your next issue on Tuesday, May 28.
Sometimes, things just don’t work out like you had hoped in the markets.
But other times… they work out almost perfectly.
That’s exactly what happened with one of my colleague Pete Carmasino’s recent calls…
As regular readers know, Pete is the chief market strategist at Chaikin Analytics.
And our team is always holding discussions to go over the markets. We talk macroeconomics and market conditions. But most importantly… we talk stocks.
This matters because it means that we’re regularly bouncing actionable ideas off each other. And many of those evolve into recommendations for our paying subscribers.
But some of those potential ideas don’t work out.
Today, let’s discuss an idea that we didn’t pull the trigger on. And it’s a good thing we didn’t – thanks to Pete. It involved a move that he called nearly to the dollar.
Better still, the tools in the Power Gauge made it clear something was going on…
As you no doubt guessed from the headline of this essay, we’re talking about Target (TGT).
On Wednesday morning, the discount-retail giant posted weak first-quarter earnings. And the stock took a beating. It tumbled 8% that day.
But not long ago, Target was a hot topic on one of our team analyst calls. After all, American consumers have been incredibly resilient with their spending.
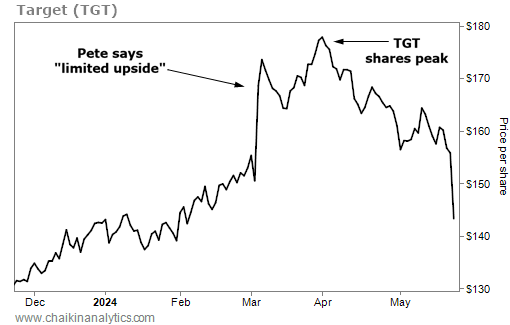
And at the time of our team discussion on March 5, Target’s stock was trading around $169 per share. Some of us thought it had a lot of upside. But Pete didn’t agree…
He told the team that he didn’t like the setup. And after the discussion, he messaged us with this brief prediction…
TGT looks good, but to me, looks like limited upside to $176 .
Again, TGT shares were trading at around $169. So Pete effectively said the stock looked like it was out of upside.
Well, Pete was about as right as it gets.
On April 1, just less than a month later, Target peaked at nearly $178 per share. Then it started turning lower. And earlier this week, it collapsed after the disappointing earnings report. Take a look…
Pete nailed it.
And as the weeks played out, the Power Gauge started showing signs to be wary. Here’s another chart of Target’s stock – this time, with some data from our system…
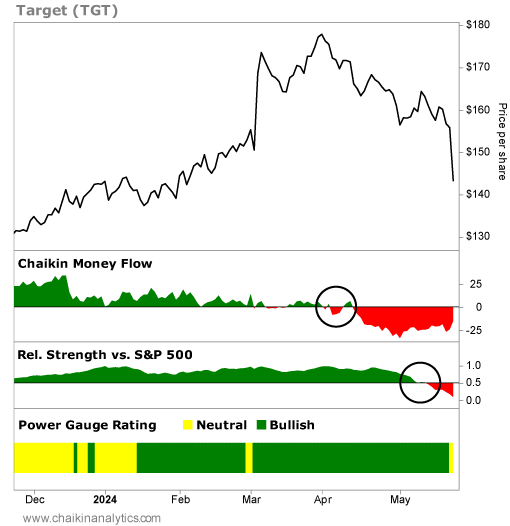
There are two key areas to focus in on here…
Start by taking a look at the Chaikin Money Flow indicator. That’s the panel right below the price chart. And it measures the so-called “smart money” trading activity on Wall Street.
As you can see, Target’s Chaikin Money Flow indicator turned negative right at the start of April. That was just after the stock peaked.
And a month later, Target’s relative strength versus the S&P 500 Index collapsed. You can see that in the panel under the Chaikin Money Flow.
Folks if you have big trades on, this is the kind of signal you need to be looking at ahead of earnings.
In Target’s case, you could have seen clearly that the smart money had stepped away from the stock. Then, its relative strength versus the market had fumbled.
And if you’re not already, I recommend you pay attention to Pete Carmasino. I’ve seen him make more calls like this than I can count.
Good investing,
Vic Lederman
Editor’s note: As regular readers know, the Power Gauge is an incredible tool…
It breaks down more than 5,000 stocks using 20 of the most important factors on Wall Street. It can help find the best stocks poised for upside. It can also help weed out the ones that look primed to fall.
And right now, you can get immediate access to the Power Gauge at a big discount…
As part of a special offer, you’ll get one year of our Power Gauge Report newsletter at 75% off the regular price. And it comes with a full year of access to our one-of-a-kind system. Get all the details here.