Editor’s note: As regular readers know, Chaikin Analytics founder Marc Chaikin has been expecting the market’s rally to broaden out in the coming months.
And he’s not alone. Our friend Sean Michael Cummings also expects similar action…
Regular readers know that Sean is an analyst over at our corporate affiliate Stansberry Research. Today, we’re sharing an essay from him that first published in the July 15 edition of Stansberry’s free DailyWealth e-letter.
In it, Sean discusses how the market looks like it’s entering a “broadening” phase. And as he explains, history says this means the bull market is likely to continue…
Some strategists are souring on the artificial-intelligence (“AI”) trade…
Global investment firm Goldman Sachs recently slammed the new technology in a report titled “Gen AI: Too Much Spend, Too Little Benefit?”
In the report, researchers highlight how many companies are preparing to spend an estimated $1 trillion on AI in the coming years. And yet, “this spending has little to show for it so far beyond reports of efficiency gains among developers.”
Of course, the long-term value of generative AI remains to be seen. It could be years before the technology generates a return.
And with ultra-high valuations in AI players like Nvidia (NVDA) and Microsoft (MSFT), it’s clear that “bubble behavior” has been forming in the tech sector.
But even if AI stumbles, it might not be enough to knock down the current bull run. As I’ll explain, a major new tailwind has recently reached the broader market…
Bearish investors will tell you the bull market still has one big problem. It’s too “narrow” – meaning only a few stocks are propping up the market.
Just look at the “Magnificent Seven” tech stocks, for example. They’ve posted massive gains this year, which helped lift the entire S&P 500 Index average. Meanwhile, smaller companies in the S&P 500 have been lagging.
So here’s where it gets tricky… As the bears point out, only a few of these mega-cap stocks need to fall to bring everything crashing down.
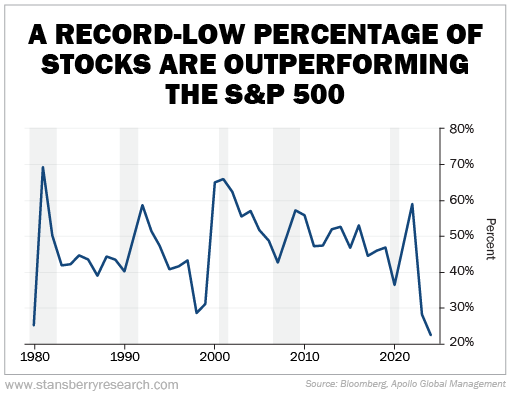
And we’ve been in one of the narrowest markets in history…
We can see this by counting how many individual stocks have been outperforming the S&P 500. The fewer the outperformers, the narrower the market.
And recently, the percentage of outperformers hit a record low. Take a look…
A bull market this narrow can resolve in one of two ways… either the gains broaden out or the market crashes.
Luckily, it looks like we’re entering the “broadening” phase. And that should propel this bull market higher.
We can see the broadening bull run using the ratio of the S&P 500 Equal Weight Index to the S&P 500…
You see, the U.S. benchmark – the S&P 500 Index – is “market-cap weighted.” That means the bigger the company, the more of the index it occupies.
However, the S&P 500 Equal Weight Index levels the playing field. It gives every stock in the index an equal share of the weight. This lets us see whether a broad spectrum of companies is rising or falling, rather than just focusing on the big ones.
So, by watching the ratio of the Equal Weight Index to the S&P 500, we can measure market breadth. And last Thursday, this ratio staged a massive leap. Check it out…
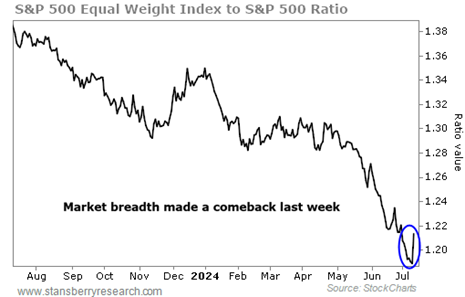
The ratio jumped 2% in a single day. That’s a rare move. The last time we saw a breadth thrust like this was in October 2020.
I wanted to see what similar one-day jumps in this ratio meant in the past. But as it turns out, this action is extremely rare. The ratio has only jumped 2% five times since 2003.
As a result, I had to lower my threshold to get a big enough sample size. So instead, I found every occasion the ratio jumped at least 1% in a single day.
Even with this wider net, the ratio made this jump on 1% of days in the past 21 years. So it’s still a rare signal.
But it was overwhelmingly bullish for stocks going forward. Take a look…
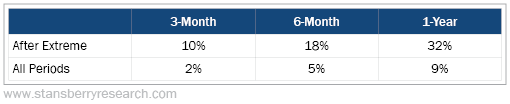
The S&P 500 has produced an average return of 9% a year going back to 2003. But that return soars when a breadth thrust like we saw last Thursday occurs.
When this ratio jumped 1%, stocks returned an eye-popping 10% in an average three-month period. In six months, they returned 18%. And after a year, they returned 32% on average.
The signal more than triples the performance of a typical buy-and-hold strategy in every time frame.
Even better, this signal was highly reliable. Stocks were up 87% of the time after the signal appeared. So stocks have history on their side today, too.
In short, don’t let the bears’ “narrow” narrative scare you out of stocks. The bull market has started its broadening phase… And history tells us stocks are likely to soar higher from here.
Good investing,
Sean Michael Cummings
Editor’s note: In DailyWealth, Sean and his colleagues aim to share some of the world’s best wealth ideas with their readers. They also break down the day-to-day opportunities they see in the markets.
Just like the PowerFeed, DailyWealth is 100% free and publishes each weekday morning that the markets are open. Learn more about DailyWealth and how to receive it by clicking here.