If you’re a finance nerd like me, you’ve probably noticed something about the VIX…
It’s really low today.
The Chicago Board Options Exchange introduced the Volatility Index – often just called “the VIX” – in the early 1990s.
In short, the VIX measures the premiums on put and call options.
That’s also known as “implied volatility.” And the higher the premiums, the higher the VIX.
Higher premiums tell us that institutional investors expect big moves in the market. They’re charging more for options because they see a less certain, more volatile future for stocks.
On the flip side, a low VIX means the so-called “smart money” isn’t worried about a lot of uncertainty. These folks don’t expect a big market shock in the short term.
But there’s a catch…
You see, a low VIX precedes just about every major market shakeup. So today’s low reading is spooking some investors.
That’s why my team and I recently dug through more than three decades’ worth of VIX data. We wanted to see if history could help guide us in the months ahead.
Here’s what we found…
The VIX closed at a record high of about 82 in March 2020. That happened during the early days of the COVID-19 pandemic.
Today, it’s around 13. As you can see on the chart below, that’s historically low…
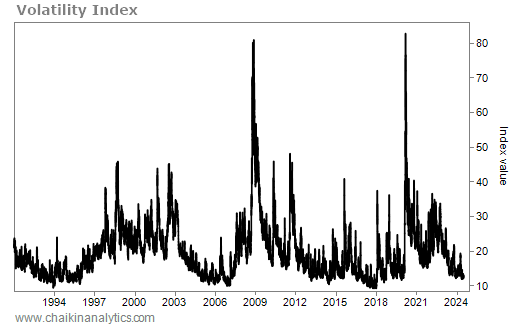
A VIX above 30 typically indicates a volatile period in the market. Notice what happened in 2008 and 2020, for example.
When the VIX is below 20, it indicates a relatively calm period.
Its current reading of about 13 is near its lowest level ever. In fact, as you can see on the chart, the VIX hasn’t been this low since right before the COVID-19 pandemic.
Now, that’s a lot of number soup. So I know what you might be thinking…
What does all this data really mean?
To figure that out, my team and I looked at the VIX going back to 1991. That’s roughly 33 years of data. And more importantly, we compared this data to the S&P 500 Index…
Specifically, we focused on every time the VIX fell below 12.5 (roughly where it is today). And we looked at the S&P 500’s performance over the following three, six, and 12 months.
The VIX’s current level is rare. The index has only been at or below 12.5 roughly 12% of the time over the past 33 years.
Now, let’s look at what would’ve happened if you only bought into the S&P 500 during two different periods. By that, I’m talking about when the VIX was above or below 12.5.
The following table shows the S&P 500’s returns in both instances over the next three, six, and 12 months. Take a look…
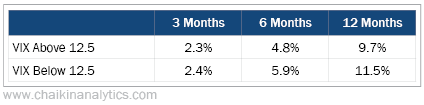
If you buy into the S&P 500 with the VIX above 12.5, you can expect to a 2.3% gain over the next three months. That’s based on the historical average when the VIX exceeds 12.5.
And over three months, the S&P 500 returns roughly the same with the VIX below 12.5.
But when we look further out… the historical results change dramatically.
When the VIX is above 12.5, the S&P 500 rises an average of 4.8% over the following six months. And it rises an average of 9.7% over the next 12 months.
Meanwhile, when the VIX is below 12.5, the S&P 500 returns an average of 5.9% over the following six months. And it returns an average of 11.5% over the next 12 months.
That’s some serious outperformance on a broad-market level.
And it’s not surprising when you think about it…
Sure, a stretch of historically low volatility often precedes big shakeups in the market. That happened in 2008 and 2020. But those types of shakeups are rare.
Most of the time, when the VIX is low, institutional investors are just telling us that they feel safe in the market. In other words, the smart money doesn’t expect huge volatility.
So it makes sense that we see solid outperformance when the smart money feels safe. And that’s exactly what decades of data shows.
The next big downturn will happen eventually. But we’re not there yet.
In the meantime, history says today’s low VIX will likely lead us to solid outperformance in stocks.
Good investing,
Vic Lederman