After a few rough months, the stock market just crossed an important threshold…
Both the S&P 500 Index and the Nasdaq 100 Index are in “correction” territory.
In other words, the market is now in a “double correction.”
A double correction means the S&P 500 and the Nasdaq 100 have both fallen at least 10% from their most recent highs at the same time. It’s a serious market condition…
You see, a correction often serves as a major psychological breakpoint for the market.
Fortunately, history is on our side. And the results might surprise you…
Since 1974, the S&P 500 has moved up an average of roughly 8% in the month after it enters correction territory. And it has gained an average of 24% over the following year.
Put simply, whatever happens next… it will be big.
So today, let’s look closer at the state of the market. You’ll see that a double correction isn’t a reason to run for the hills. Instead, as always, we’ll let the Power Gauge guide us…
First, corrections like the one we’re in today are more common than most folks realize.
From 2002 through 2021, the S&P 500 experienced a full-blown correction in 10 out of 20 years. That’s half the time. Plus, a couple of other near-correction events occurred as well.
In other words, the S&P 500 experienced a major drawdown at least every other year.
I get it if you feel like we’re dealing with a unique and trying time as investors today. But the data shows that the market’s recent double correction isn’t as unusual as it might seem.
Now, let’s turn our attention to what this setup looks like on the chart.
We’ll start with the S&P 500. It’s down about 10% from its high on July 31. Take a look…
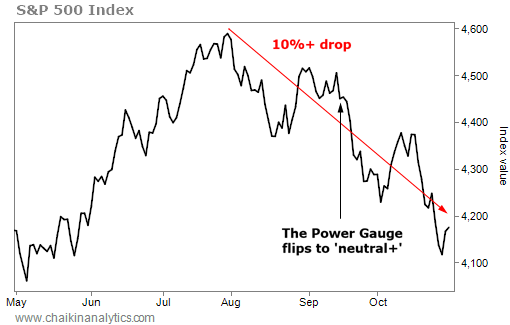
The above chart shows the S&P 500’s performance over the past six months. And as you can see, the index officially entered correction territory at the end of last week.
I’ve also highlighted something else on the chart…
In short, the Power Gauge flipped to a “neutral+” rating for the S&P 500 on September 15. The system urged us to be careful with the index. And it did that long before the correction.
A similar situation is playing out with the Nasdaq 100 today. At Chaikin Analytics, we track this tech-heavy index through the Invesco QQQ Trust (QQQ). Take a look…
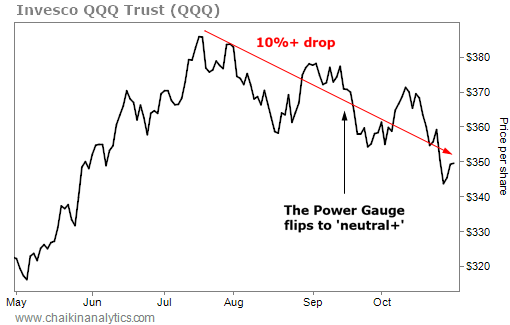
Once again, you can see that QQQ officially crossed into correction territory last week.
The Power Gauge signaled its first warning about QQQ on September 15. Then, after a short flip back to a “bullish” rating in early October, the system once again dropped to “neutral+.”
Let’s pull back the curtain a little bit further. Specifically, here are the Power Bar ratios for QQQ and the SPDR S&P 500 Fund (SPY), which we use to track the S&P 500…
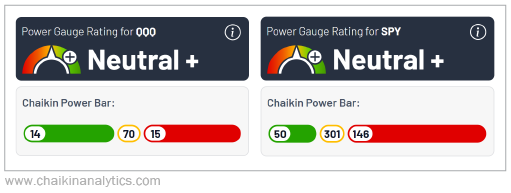
Regular readers know the Power Bar ratio is a quick look at the Power Gauge’s ratings…
Today, “neutral” is the dominant rating for both indexes. Roughly 60% of the stocks in the S&P 500 earn that rating. And a whopping 78% of the rated stocks in QQQ are “neutral.”
The situation we’re facing as investors today is clear…
Stocks are in a challenging position. The market recently entered a double correction. By that, I mean two important indexes have fallen at least 10% from their recent highs.
Fortunately, history tells us that we don’t need to fear this setup. We don’t need to give up and sell everything. A “V-shaped” recovery is common after a market correction.
I’ll keep watching these indexes closely in the Power Gauge. You should do the same.
Good investing,
Vic Lederman