Editor’s note: The markets and our offices are closed on Monday, July 4, for Independence Day. Because of this, we won’t publish Chaikin PowerFeed. Please look for your next issue on Tuesday, July 5.
No one can predict the investment world’s future – but that doesn’t stop them from trying.
Every research report, fact sheet, investment presentation, and marketing ad in the financial-services business all say the same thing at the bottom…
Past performance is not indicative of future results.
Despite this, most analysts use the “expected return” to forecast future results. And where do they get the expected return? From corporations’ past performance, of course.
Currently, analyst estimates have the S&P 500 trading at the mathematically right price. But if you factor in slower growth, the story shifts. In fact, another 15% fall might put the index closer to the right price.
Let me explain…
When a corporation reports earnings, it also gives guidance. Management attempts to “see the future,” so to speak… at least in the short term.
And lately, corporations are sending out warning signals through negative guidance. (Negative guidance is any estimate that’s below the average earnings estimates on record.)
As its name suggests, the S&P 500 holds 500 stocks. Collectively, the total earnings of its holdings give us the index’s earnings estimate. That number is $230 today.
To date, 20% of the companies in the S&P 500 have lowered their guidance for the rest of 2022. A total of 136 have lowered guidance for full-year 2022. And some went as far out as 2023.
The index trades every day. And we can see the price it trades at.
As of yesterday’s close, the S&P 500 sits at roughly 3,785. That means the price-to-earnings (P/E) ratio is 16.46 (3,785 divided by $230). That’s slightly below the 10-year average P/E ratio of 17.
The index’s current earnings estimate for 2023 is $251. That would put its 2023 P/E ratio at 15.07.
That 2023 number is misleading. It makes the index seem like it trades too low. Take a look at the following chart. It shows earnings for the S&P 500 from 2012 through 2021, plus estimates for the next two years…
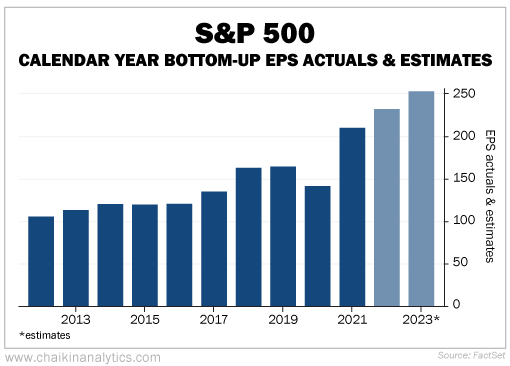
Using this chart, you can see the S&P 500’s growth rate. Earnings for each year have been higher than the previous year. The only exception was during the height of the pandemic in 2020.
The data helps put things in perspective. But we can take it a step further… We can use simple math to produce our own estimate.
Let’s say you just ran 40 yards in 5 seconds… and I asked you to do it again, but carrying 20 pounds this time. Would you be able to keep the pace up? Probably not. You’d almost certainly be slower.
Well, the same thing goes for the economy. The companies that warned they’d be “slower” issued an average of 4.3% lower guidance.
And there’s more weight to carry. The Fed expects 5.2% inflation by year end.
Throw in the percentage increases in fuel, labor, and materials… and the discounts start to add up.
The bottom line is this – if we conservatively discount the current 2022 earnings estimate by only 13%, we get $200. If we take the S&P 500’s average P/E ratio of 17, the index can trade to 3,400. That’s a 10% drop from today’s levels.
If the P/E ratio trades in line with next year’s 15.07 estimate, that takes it down to roughly 3,000.
No matter the number, the market won’t be happy when the pros catch on. Don’t wait for analysts to downgrade the market. Do it yourself.
Good investing,
Pete Carmasino