Things are looking up in the markets…
Sure, we’ve recently experienced some volatility. And the S&P 500 Index is only about breakeven over the past two months.
But we’re still a long way from the October bottom. The overall trend is in our favor. And several market sectors are beginning to outperform others…
For example, financial companies as a whole have thrived since October. The Financial Select Sector SPDR Fund (XLF) is up around 11% in that span.
Notably, our Power Gauge system turned “bullish” on this sector in mid-October. This change happened within a couple days of the market’s bottom.
Even better, XLF still earns a “very bullish” Power Gauge rating today…
That tells us the financial sector remains very strong overall. And we can expect many companies in this sector to outperform the market in the coming months.
But the thing is… this “very bullish” outlook doesn’t mean every financial stock is a winner.
Not by a long shot.
Today, let’s look closer at the financial sector. While we’re doing that, we’ll detail how the Power Gauge could’ve helped you avoid a massive wipeout within the space…
First, look at the one-year chart of the Financial Select Sector SPDR Fund. It’s the exchange-traded fund (“ETF”) we use in the Power Gauge to track the financial sector…
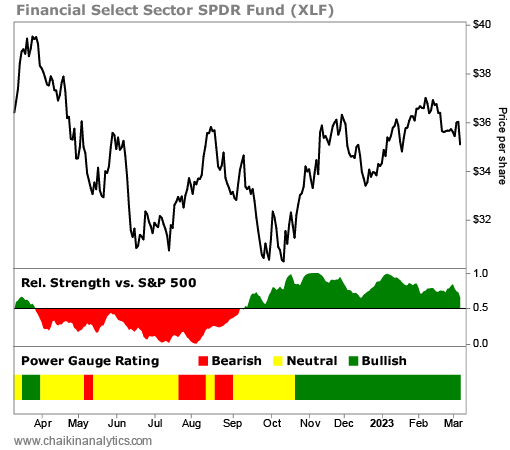
At the bottom of the chart, you’ll see the Power Gauge rating.
This panel shows the trend of the ETF’s overall ratings over the past year. Green is “bullish” or “very bullish.” Red is “bearish” or “very bearish.” And finally, yellow signifies “neutral.”
As I said earlier, the Power Gauge turned green (“very bullish”) on XLF in mid-October. Since then, the ETF has thrived. It’s up about 11% in that span.
But a “very bullish” rating for a sector doesn’t mean every single stock is worth buying. In fact, some of the market’s worst performers these days are in “very bullish” sectors.
Fortunately, the Power Gauge does more than just help us find the market’s best opportunities. It also warns us about the biggest potential losers. And in turn, it helps us avoid catastrophe.
Let’s use Silvergate Capital (SI) as an example…
At its core, Silvergate is a bank. So it clearly fits into the financial sector. But in recent years, it became better known for its ties to the cryptocurrency space.
Of course, bitcoin is the world’s most popular crypto. It’s down almost 70% from its peak in November 2021. And in the following chart, we can see that Silvergate is suffering more…
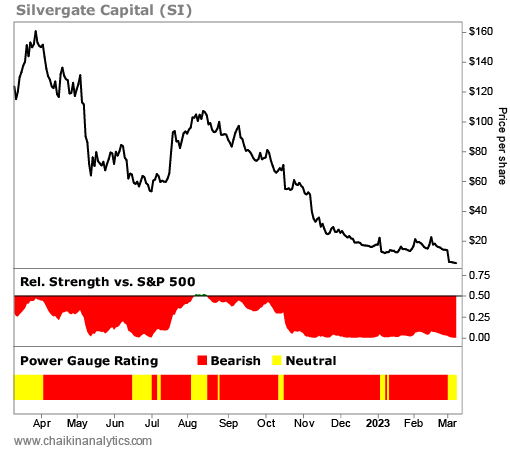
Silvergate briefly traded for more than $220 per share in November 2021. As recently as the end of March 2022, the stock was around $160 per share.
But now, Silvergate trades at around $2.85 per share. That’s a staggering loss of around 98% in less than a year.
Again, look at the Power Gauge rating at the bottom of the chart…
The Power Gauge turned “very bearish” on Silvergate on April 4, 2022. So folks who used our system could’ve saved themselves from losing roughly 98% of their money.
In fact, they could’ve avoided a total wipeout…
Silvergate announced Wednesday night that it will go out of business.
That’s right. It’s going beyond bankruptcy. It’s completely closing up shop.
Specifically, Silvergate plans to start winding down operations and liquidating its bank.
That means investors who’ve held onto this stock have no chance of making back all their losses. And they just needed to do a little extra research to avoid this terrible situation.
Many investors use the Power Gauge to spot potential winners. And it’s true that finding consistent winners is a great way to grow your wealth over the long run.
But as we’ve learned today, the system can also protect investors like us from catastrophe. By alerting us to dangers like Silvergate Capital, it help us avoid massive losses.
Keep that in mind as you navigate today’s ever-changing market.
Good investing,
Briton Hill