We learned last week that inflation remains out of control…
The U.S. Bureau of Labor Statistics announced that the Consumer Price Index was 8.5% higher in March than a year earlier. That’s the highest year-over-year reading since 1981.
Of course, government experts might point out that it’s not so bad for folks who are willing to starve, freeze, and stop driving. (That’s because, in their words, the rise in so-called “core inflation” – which doesn’t count food and energy – was lower than expected.)
President Joe Biden is to blame, according to some so-called experts. Others believe corporate greed is the cause.
Folks love to point fingers at the Federal Reserve, too. And everybody enjoys blaming Russia and COVID-19-related supply disruptions.
Here’s what nobody is talking about… monetary velocity.
Now, maybe monetary velocity isn’t a household financial term. But it’s a crucial part of the well-recognized link between the money supply and inflation.
Over the next couple of days, we’ll dive deeper into this idea. And more importantly, by tomorrow, we’ll figure out exactly what it all could mean for everyday investors like us…
We’ll start at the top with the grand monetary formula…
M x V = P x T
On the right side of the formula, “P” stands for prices and “T” stands for transactions.
When we combine these figures, we wind up with the dollar value of all economic activity. It’s also known as nominal gross domestic product (that is, not adjusted for inflation).
The good stuff is on the left side of the equation. “M” stands for money supply and “V” stands for the velocity of money.
If the Federal Reserve increases the money supply, then the economy (prices times transactions) will rise. This basic premise is known as the “quantitative theory of money.”
The thing is, a lot can go wrong. And we’re seeing that play out in our economy today…
You see, the velocity of money refers to the pace at which money circulates through the economy. In other words, money stored under a mattress has no velocity. On the other hand, money spent on goods and services is positive velocity.
When I first learned about monetarism in school many years ago, the eggheads assumed velocity was more or less known and stable. But as it turns out, the real world is far harsher than the toughest professor.
Look at what happened to the velocity of money in recent decades…
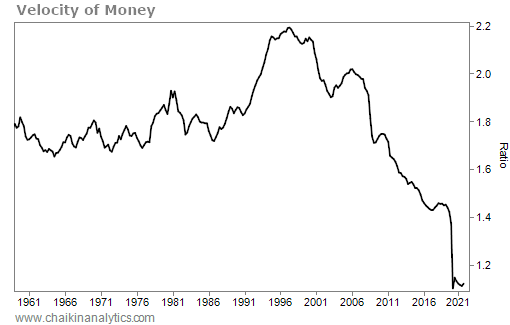
As you can see, the velocity of money in the U.S. started falling around 1995. Then, in early 2020, velocity fell off a cliff because of pandemic-related shutdowns.
It’s tempting to assume that the recent inflation simply reflects a recovery in the velocity of money working hand in hand with money-supply growth… But the chart doesn’t reflect that.
Velocity had been falling steadily for about 25 years before the COVID-19 pandemic. And the recent surge in inflation doesn’t come with a corresponding spike in velocity.
That tells us the eggheads missed something big. After all, the money supply has increased dramatically in recent history. And yet, the velocity of money hasn’t increased in that span.
Peek at the grand monetary formula again… M x V = P x T
In short, declines in the velocity of money (V) are offsetting increases in the money supply (M). And that has big implications… If velocity were to change direction – or simply stop falling – we could be in for some really scary inflation numbers down the road.
As investors, our money is on the line. So even though this topic is a little in the weeds, we can’t afford to be carefree about monetary velocity.
Tomorrow, we’ll look at the causes of the dramatic fall in the velocity of money… its potential future direction… and exactly what it all means for everyday investors like us.
Good investing,
Marc Gerstein